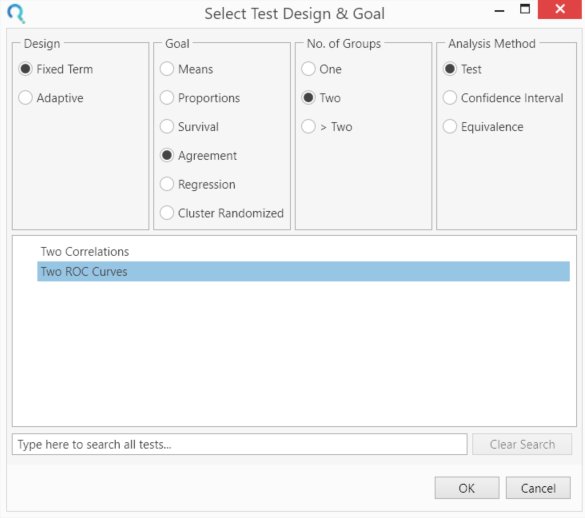
Explore the Scientific R&D Platform

Try Now
Pricing
MENU
Try Now
Pricing

Sample Size Determination Example

AREA: Means | Hepatology

nQuery In Use Background Web  Opacity 35

Hepatology Research

TitleDifferential Methylation of the Promoter and First Exon of the RASSF1A Gene in Hepatocarcinogenesis

Objective: Aberrant methylation of the promoter, P2, and the first exon, E1, regions of the tumor suppressor gene RASSF1A, have been associated with hepatocellular carcinoma (HCC), albeit with poor specificity. This study analyzed the methylation profiles of P1, P2 and E1 regions of the gene to identify the region of which methylation most specifically corresponds to HCC and to evaluate the potential of this methylated region as a biomarker in urine for HCC screening.

Year: 2014

Source: Hepatology Research

Link: http://onlinelibrary.wiley.com/doi/10.1111/hepr.12449/abstract

Clinical Area: Oncology/Hepatology/Genetic Screening

Sample Size Section in Paper/Protocol:

Note: A sample size of 120 from the positive group (HCC) and 70 from the negative group (cirrhosis and hepatitis) achieves 85% power to detect a difference of 0.10 between the two diagnostic tests, with an AUROC of 0.90, and another diagnostic test with an AUROC of 0.80, using a two-sided z-test at a significance level of 0.05.[50, 51]”


Note: Correlation between results for positive and negative values are not mentioned implying independent samples. This is easily accommodated within this table by setting the correlation between responses to zero.


Summary of Necessary Parameter Estimates for Sample Size Calculation:

 Parameter Value
 Significance Level (Two-Sided) 0.05
 Discrete or Continuous Continuous
 Reference AUC  0.09
 Test AUC 0.08
 Correlation Between Responses 0
Sample Size Ratio .583
Power 85

Email me this example in PDF format

 Step 1: 
Select the 'Two ROC Curves' from the Study Design Pane.

This can be done using the radio buttons or alternatively, you can use the search bar at the end of the Select Test Design & Goal window.

 Sample Size Calculator Example- nQuery- Example 03- Img 01- Two ROC Curves-1

 Step 2:
Enter the parameter values for sample size calculation taken from the study design.
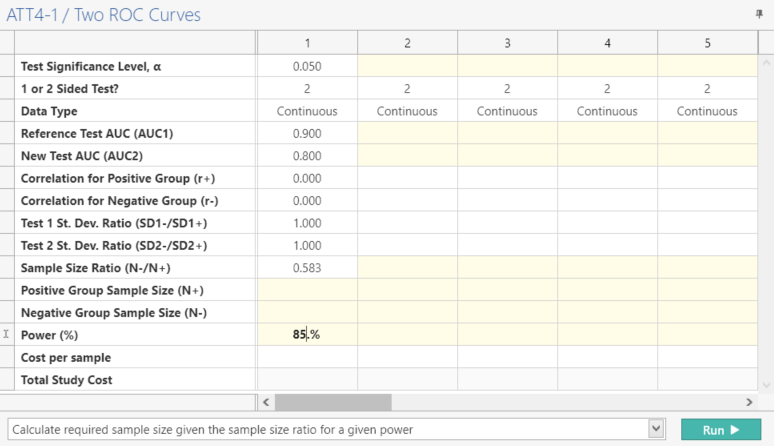
Sample Size Calculator Example- nQuery- Example 03- Img 03- Two ROC Curves

Step 3:
Select “Calculate required overall sample size given the sample size ratio (N-/N+) for a given power”, click the “Run” button to solve for the sample size.

This gives a sample size of 120 positive cases and 70 negative cases as per the study design.


Sample Size Calculator Example- nQuery- Example 03- Img 03- Two ROC Curves

Note: When using nQuery Advanced, both the Positive and Negative Sample Size will be auto-calculated once the Power (%) value is entered.
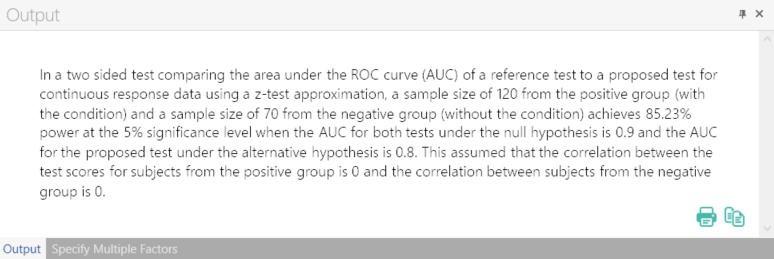
Step 4:
Once the calculation is completed, nQuery Advanced provides an output statement summarizing the results. It States:

Output Statement:

“In a two sided test comparing the area under the ROC curve (AUC) of a reference test to a proposed test for continuous response data using a z-test approximation, a sample size of 120 from the positive group (with the condition) and a sample size of 70 from the negative group (without the condition) achieves 85.23% power at the 5% significance level when the AUC for both tests under the null hypothesis is 0.9 and the AUC  for the proposed test under the alternative hypothesis is 0.8. This assumed that the correlation between the test scores for subjects from the positive group is 0 and the correlation between subjects from the negative group is 0.”


Sample Size Calculator Example- nQuery- Example 03- Img 04- Two ROC Curves


Email me this example in PDF format

Free 14 Day Trial

Demo Icon white
No download required