Explore the Scientific R&D Platform

Try Now
Pricing
MENU
Try Now
Pricing

Sample Size Determination Example

AREA: Agreement | Veterinary

nQuery In Use Background Web  Opacity 35

Zoetis Dairy Science Research

TitleEvaluation of selective dry cow treatment following on-farm culture: Risk of postcalving intramammary infection and clinical mastitis in the subsequent lactation.

Objective:  The objective of the study was to evaluate the utility of a Petrifilm-based on-farm culture system when used to make selective antimicrobial treatment decisions on low somatic cell count cows (<200,000 cells/mL) at drying off. A total of 729 cows from 16 commercial dairy herds with a low bulk tank somatic cell count (<250,000 cells/mL) were randomly assigned to receive either blanket dry cow therapy (DCT) or Petrifilm-based selective DCT.

Year: 2014

Source:  Journal of Dairy Science

Link: http://www.sciencedirect.com/science/article/pii/S0022030213007352

Clinical Area: Veterinary

Sample Size Section in Paper/Protocol:

“Sample size calculations were based on a published prevalence of IMI at calving
of approximately 20% when both DCT and ITS were used at drying off (Godden
et al., 2003; Sanford et al., 2006a). With a significance level of 95% (2-sided) and
a power of 80%, it was determined that approximately 2,280 quarters (570 cows
with 285 being in each group) would be required to detect a minimum change in
risk of IMI at calving from 20 to 25% (margin of noninferiority of 5%). This
calculation assumes that quarters within a cow are independent, although
research has shown interdependence of quarters with respect to IMI (Barkema et
al., 1997; Berry and Meaney, 2006). To account for clustering of quarters within
cows, an adjustment to the sample size was made using a published intraclass
correlation coefficient (ρ) of 0.20 (Barkema et al., 1997; Berry and Meaney,
2006), resulting in a sample size of 3,632 quarters (908 cows, with 454 per
group).”


Summary of Necessary Parameter Estimates for Sample Size Calculation:

 Parameter Value
 Significance Level (2-Sided) 0.05
 Expected Prevalence Difference  -0.05
 Control Group Prevalence 0.2
 ICC 0.2
Sample Size per Cluster/Cow 4
Cluster/Cows per Group 454

Email me this example in PDF format

Step 1: 

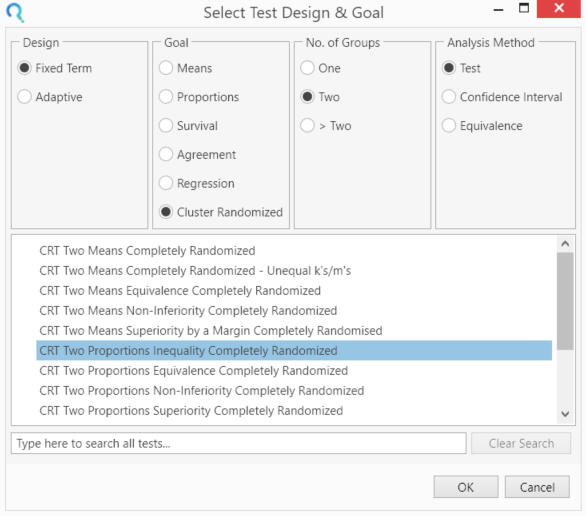
Select the CRT Two Proportions Inequality Completely Randomised table.

This can be done using the radio buttons or alternatively, you can use the search bar at the end of the Select Test Design & Goal window.

Sample Size Calculator Example- nQuery- Example 05- Img 01- CRT Two Proportions Inequality Completely Randomised

Step 2:
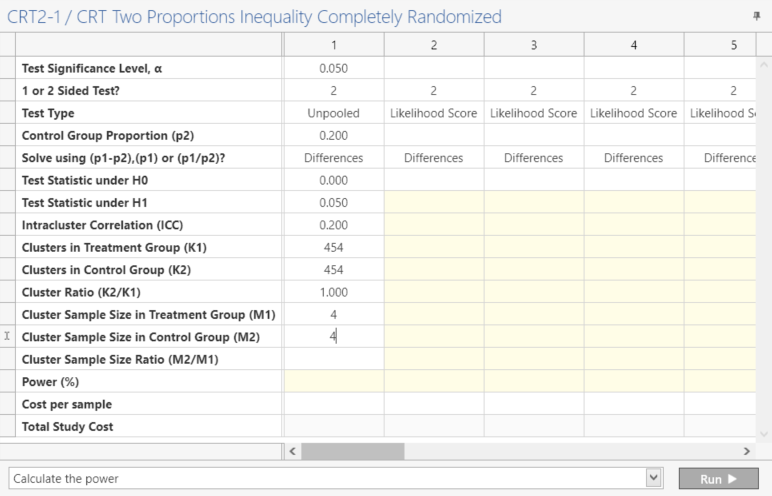
Enter the parameter values for power calculation taken from the study protocol.

Sample Size Calculator Example- nQuery- Example 05- Img 02- CRT Two Proportions Inequality Completely Randomised

Step 3:
Once the parameter values are entered from Step 2, click Run.

This analysis gives a power of 81.529 / 81.53 as per the targeted power of 80%


Sample Size Calculator Example- nQuery- Example 05- Img 03- CRT Proportions

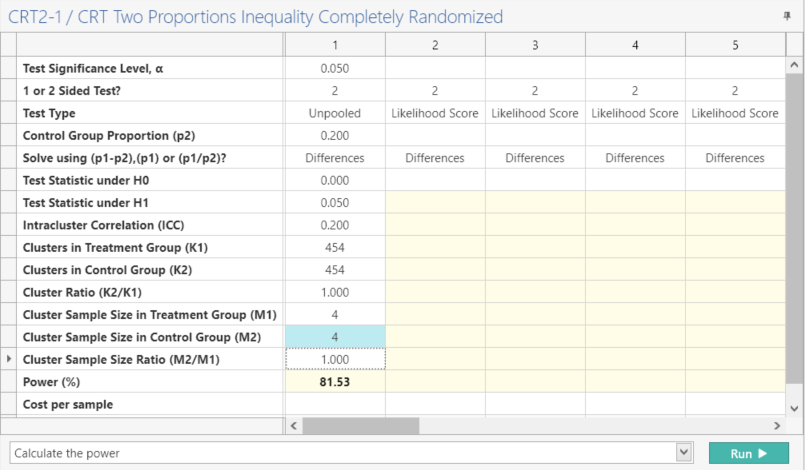
The slight increase in power could be due to rounding or different assumptions
regarding the test statistic used e.g. continuity correction, chi-squared statistic,
sine adjustment.

Note: When using nQuery Advanced both the Cluster Sample Size Ratio and Power (%) will be auto-calculated once all the parameter values from Step 2 are entered.

Step 4:
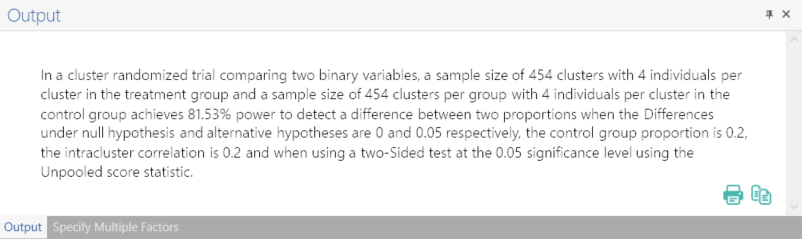
Once the calculation is completed, nQuery Advanced provides an output statement summarizing the results. It States:

Output Statement:

“In a cluster randomized trial comparing two binary variables, a sample size of 454 clusters with 4 individuals per cluster in the treatment group and a sample size of 454 clusters per group with 4 individuals per cluster in the control group achieves 81.53% power to detect a difference between two proportions when the Differences under null hypothesis and alternative hypotheses are 0 and 0.05 respectively, the control group proportion is 0.2, the intracluster correlation is 0.2 and when using a two-Sided test at the 0.05 significance level using the Unpooled score statistic.”  


Sample Size Calculator Example- nQuery- Example 05- Img 04 - CRT Two Proportions Inequality Completely Randomised-1


Email me this example in PDF format

Free 14 Day Trial

Demo Icon white
No download required