Explore the Scientific R&D Platform

Try Now
Pricing
MENU
Try Now
Pricing

Sample Size Determination Example

AREA: Proportions | Veterinary

nQuery In Use Background Web  Opacity 35

Zoetis Veterinary Research

TitleBovine viral diarrhoea virus in beef heifers in commercial herds in Australia: mob-level seroprevalences and incidences of seroconversion, and vaccine efficacy

Objective: To describe management group (mob)‐level seroprevalences and incidences of seroconversion to bovine viral diarrhoea virus (BVDV), and to determine the efficacy of a vaccine against BVDV, in beef heifers in commercial herds in Australia.

Year: 2013

Source: New England Journal of Medicine

Link: http://onlinelibrary.wiley.com/doi/10.1111/avj.12129/abstract

Clinical Area: Veterinary (Bovine)

Sample Size Section in Paper/Protocol:

“We planned to enrol 2500 heifers (1250 each of Pestigard®- and placebo-treated heifers). Statistical power calculations indicated that the trial would have had power of 0.72, 0.73 and 0.91 for detecting a significant difference at the 0.05 level (two-sided) in proportions of heifers that were pregnant by 6 weeks between Pestigard® and placebo treated heifers, if the proportions in the placebo-treated heifers were 40%, 60% and 80%, respectively, and if Pestigard® treatment increases these proportions by 0.05 (i.e. 5 percentage points). If the increase is 0.10 (i.e. 10 percentage points), statistical power would have been 1.00.

Power for detecting differences in proportions of heifers with calves at branding or weaning of 5 and 10 percentage points would have been 0.91 and 1.00 if 80% and 90% of the placebo-treated heifers had a calf at branding and weaning, respectively. Sample size calculations were performed using WinPepi[10] and did not account for clustering of heifer within mob as the numbers of Pestigard®- and placebo-treated heifers were to be very similar so there would be minimal impact of clustering on variance inflation factors.”


Summary of Necessary Parameter Estimates for Sample Size Calculation:

 Parameter 40% 60% 80%
 Significance Level (2-Sided) 0.05 0.05 0.05
 Control Proportion 0.4 0.6 0.8
 Treatment Proportion 0.45 0.65 0.85
 Sample Size Per Group 1250 1250 1250


Note: that clustering was not taken into account in this analysis. Our cluster 
randomised table would allow investigators to easily investigate the effect it could have had on the power estimate and prevent an underpowered study.

Email me this example in PDF format

Step 1:
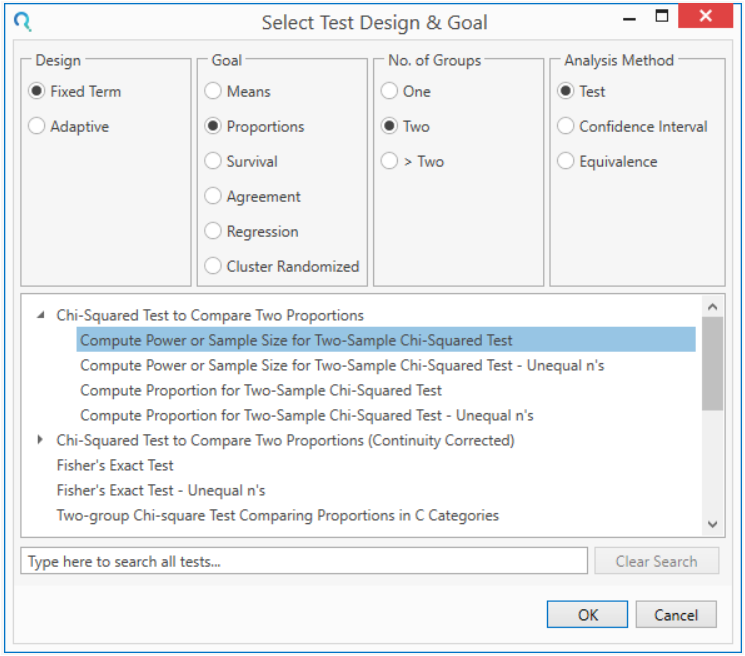
Select the table Compute Power or Sample Size for Two-Sample Chi-Squared Test from the Select Test Design & Goal window.

This is located under the Chi-Squared Test to Compare Two Proportions dropdown

This can be done using the radio buttons or alternatively, you can use the search bar at the end of the Select Test Design & Goal window.

Sample Size Calculator Example- nQuery- Example 18- Img 01- Compute Power or Sample Size for Two-Sample Chi-Squared Test

Step 2:
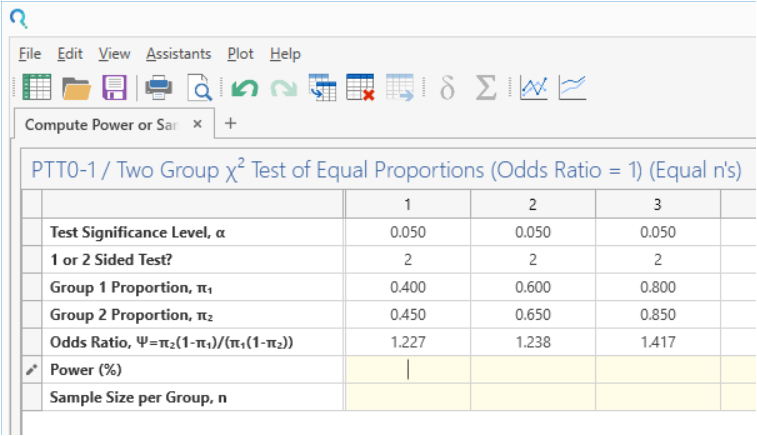
Enter the parameter values for sample size calculation taken from the study design.

Sample Size Calculator Example- nQuery- Example 18- img 02- Compute Power or Sample Size for Two-Sample Chi-Squared Test

Step 3:
Enter the sample size. Once the sample size is entered, the power is calculated automatically. Make sure ‘Calculate the power’ is selected from the action dropdown menu.

Sample Size Calculator Example- nQuery- Example 18- img 03- Compute Power or Sample Size for Two-Sample Chi-Squared Test

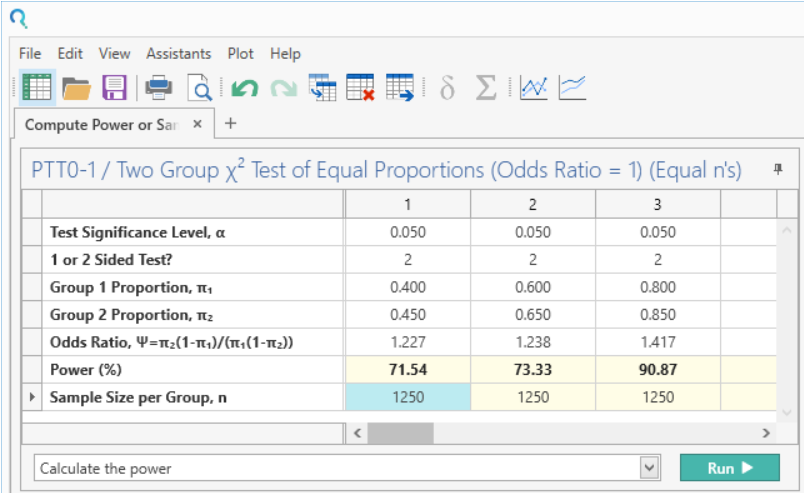
This gives rounded powers of 72%, 73% & 91% as per the study design Statement.


Step 4:
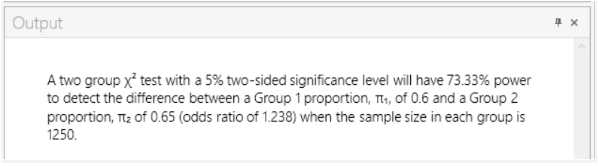
An output statement is available for each scenario. Just click the corresponding column to get the output statement for that scenario.

The output statement appears at the bottom of nQuery. This can be printed or copy and pasted into any document.

Output Statement:

A two group χ² test with a 5% two-sided significance level will have 73.33% power to detect the difference between a Group 1 proportion, π₁, of 0.6 and a Group 2 proportion, π₂ of 0.65 (odds ratio of 1.238) when the sample size in each group is 1250..”


Example 18 Img 04

Email me this example in PDF format

Free 14 Day Trial

Demo Icon white
No download required