Explore the Scientific R&D Platform

Try Now
Pricing
MENU
Try Now
Pricing

Sample Size Determination Example

AREA: Agreement | Urology

nQuery In Use Background Web  Opacity 35

Prostate Cancer Research

TitleProstate Specific Antigen/Solvent Interaction Analysis (PSA/SIA): A Preliminary Evaluation of a New Assay Concept for Detecting Prostate Cancer Using Urinary Samples

Objective: To provide preliminary clinical performance evaluation of a novel prostate cancer (CaP) assay, prostate-specific antigen/solvent interaction analysis (PSA/SIA) that focused on changes to the structure of PSA.

Year: 2011

Source: Urology

Link: http://www.sciencedirect.com/science/article/pii/S009042951100567X

Clinical Area: Oncology/Urology

Sample Size Section in Paper/Protocol:

“Based on these currently available standards, in our sample size calculations, we considered the null hypothesis H0: AUC = 0.8 versus either the one-sided (H1: AUC > 0.8) or two-sided (H1: AUC ≠ 0) alternative. For both alternatives, the necessary sample size was calculated to achieve at least 85% statistical power to detect AUC of 0.9. We assumed that the ratio of cases (those with diagnosed CaP) to controls (those without cancer) was between 2/3 and 1. The calculations were based on the estimate of AUC proposed by Hanley and McNeil that is a function of the ROC area and the sample size only. This method is based on an exponential distribution approximation to the standard error of the ROC area which has been shown to provide a very good approximation for a variety of underlying distributions for continuous diagnostic characteristics. The calculations show that the necessary sample size for the one-sided alternative is 120 samples while for the two-sided alternative it is 150 samples. ROC analysis was based on the nonparametric Mann-Whitney procedure. The resultant analysis indicates that a post hoc H0: AUC=0.9 is rejected at the 5% level using a two-sided statistical test.”

Note: A range is given for sample size ratio so we conduct a sensitivity analysis over the extremes of that range. They also give figures for the 1-sided and 2-sided test and these are both tested below.


Summary of Necessary Parameter Estimates for Sample Size Calculation:

 Parameter Value
 Significance Level 0.05
 Discrete or Continuous Continuous
 Null Hypothesis 0.73
 Alternative Hypothesis 0.85
 Sample Size Ratio 1-1.5
Power 80

Email me this example in PDF format

Step 1:
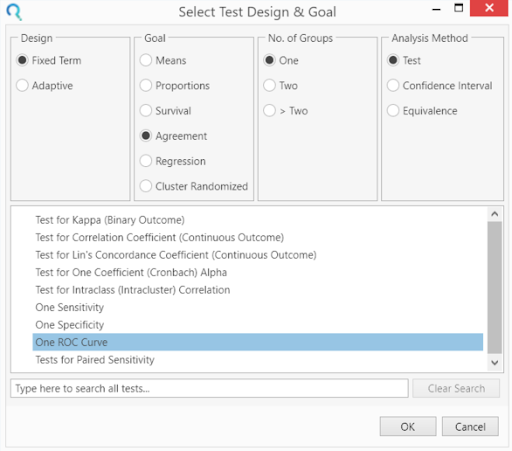
Select the One ROC Curve table from the Select Test Design & Goal window.

This can be done using the radio buttons or alternatively, you can use the search bar at the end of the Select Test Design & Goal window.

 Sample Size Calculator Example- nQuery- Example 04- Img 01- CRT Two Proportions Inequality Completely Randomised

Step 2:
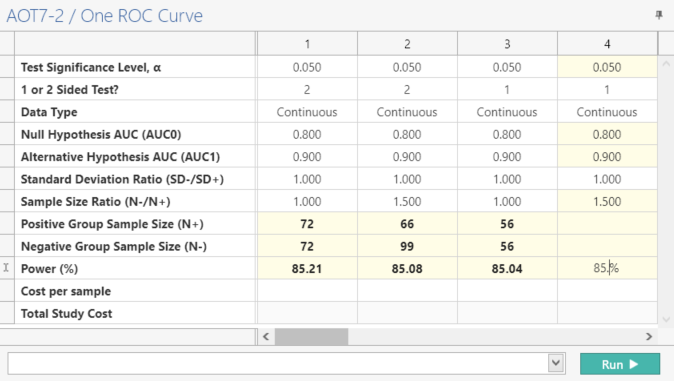
Enter the parameter values for sample size calculation taken from the study protocol.

Sample Size Calculator Example- nQuery- Example 04- Img 02- CRT Two Proportions Inequality Completely Randomised

Step 3:
Select “Calculate required overall sample size given the sample size ratio (N-/N+) for a given power”.

Check the “All Columns” box and click the “Run” button to solve for the power.

For the 2-sided case, the total sample size ranges from 144 to 165 which includes the study value of 150. For the 1-sided case, the total sample size ranges from 112 to 130 which includes the study value of 120.


Sample Size Calculator Example- nQuery- Example 04- Img 03- CRT Two Proportions

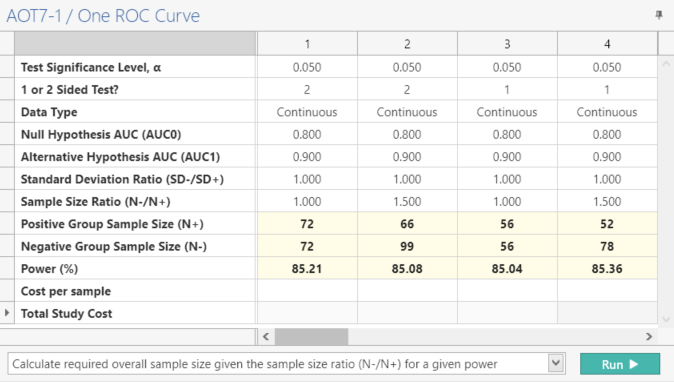
Note: When using nQuery Advanced, both the Positive and Negative Sample Size will be auto-calculated once the Power (%) value is entered.

Step 4:
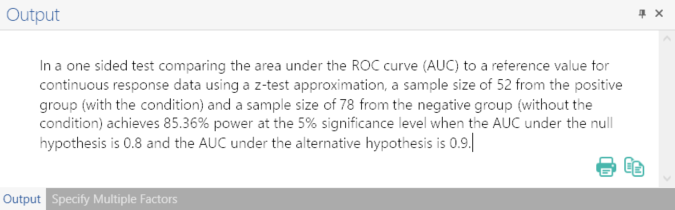
Once the calculation is completed, nQuery Advanced provides an output statement summarizing the results. It States:

Output Statement:

“In a one sided test comparing the area under the ROC curve (AUC) to a reference value for continuous response data using a z-test approximation, a sample size of 52 from the positive group (with the condition) and a sample size of 78 from the negative group (without the condition) achieves 85.36% power at the 5% significance level when the AUC under the null hypothesis is 0.8 and the AUC under the alternative hypothesis is 0.9.”  


Sample Size Calculator Example- nQuery- Example 04- Img 04- CRT Two Proportions Inequality Completely Randomised

Email me this example in PDF format

Free 14 Day Trial

Demo Icon white
No download required