Explore the Scientific R&D Platform

Try Now
Pricing
MENU
Try Now
Pricing

Sample Size Determination Example

AREA: Means | Urology

nQuery In Use Background Web  Opacity 35

Allergan Urinary Incontinence Research

TitleAnticholinergic Therapy vs. OnabotulinumtoxinA for Urgency Urinary Incontinence

Objective: We performed a double-blind, double-placebo–controlled, randomized trial involving women with idiopathic urgency urinary incontinence who had five or more episodes of urgency urinary incontinence per 3-day period, as recorded in a diary. For a 6-month period, participants were randomly assigned to daily oral anticholinergic medication (solifenacin, 5 mg initially, with possible escalation to 10 mg and, if necessary, subsequent switch to trospium XR, 60 mg) plus one intradetrusor injection of saline or one intradetrusor injection of 100 U of onabotulinumtoxinA plus daily oral placebo. The primary outcome was the reduction from baseline in mean episodes of urgency urinary incontinence per day over the 6-month period, as recorded in 3-day diaries submitted monthly. Secondary outcomes included complete resolution of urgency urinary incontinence, quality of life, use of catheters, and adverse events.

Year: 2012

Source: New England Journal of Medicine

Link: http://www.nejm.org/doi/full/10.1056/NEJMoa1208872

Clinical Area: Urology

Sample Size Section in Paper/Protocol:

“A sample size of 242 subjects (121 per treatment group) provides at least 80% power to detect a relative difference of 53% between botulinum toxin A and standardized anticholinergic therapy, assuming a treatment difference of -0.80 and a common SD of 2.1 (effect size = 0.381), and a two-sided type I error rate of 5%. Sample size has been adjusted to allow for a 10% loss to follow-up over the 6-months of treatment as well as one interim analysis to stop early for benefit.”

 
                                                                     Note:
                                                         From Table 6 of Protocol:
                   Mean for ACH Group: -1.5, Mean for OnabotulinumtoxinA group: -2.3

Summary of Necessary Parameter Estimates for Sample Size Calculation:

 Parameter Value
 Significance Level (2-Sided) 0.05
 Expected OnabotulinumtoxinA Mean -2.3
 Expected Antichollnergic Therapy Mean -1.5
 Standard Deviation (Both Groups) 2.1
 Power 80%
Number of Interim Analyses 1
Alpha Spending Function (from Protocol) O'Brien-Fleming
Expected Dropout 10%

Email me this example in PDF format

Step 1: 
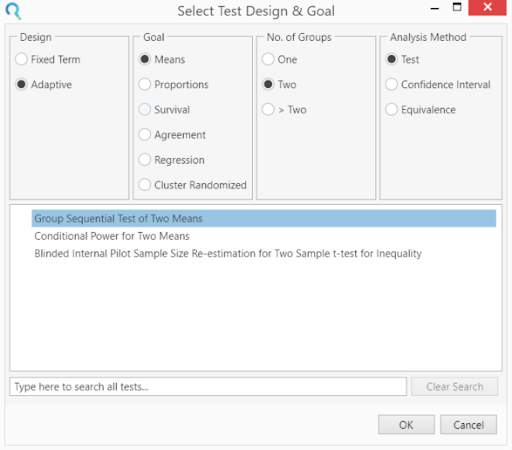
Select the Group Sequential Test of Two Means table from the Select Test Design & Goal window.

This can be done using the radio buttons or alternatively, you can use the search bar at the end of the Select Test Design & Goal window.

Sample Size Calculator Example- nQuery- Example 15- Img 01- Group Sequential Test of Two Means

Step 2:
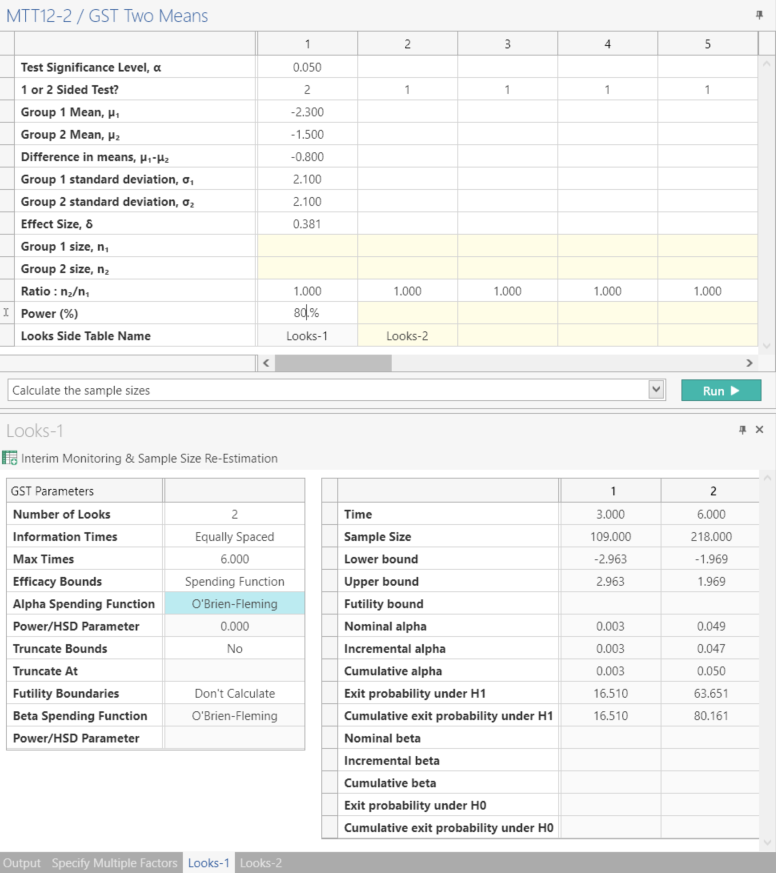
Enter the parameter values for sample size calculation taken from the study protocol.

Setting the “Number of looks” row to two specifies one interim analysis and one endpoint analysis.

Sample Size Calculator Example- nQuery- Example 15- Img 02- Group Sequential Test of Two Means

Step 3:
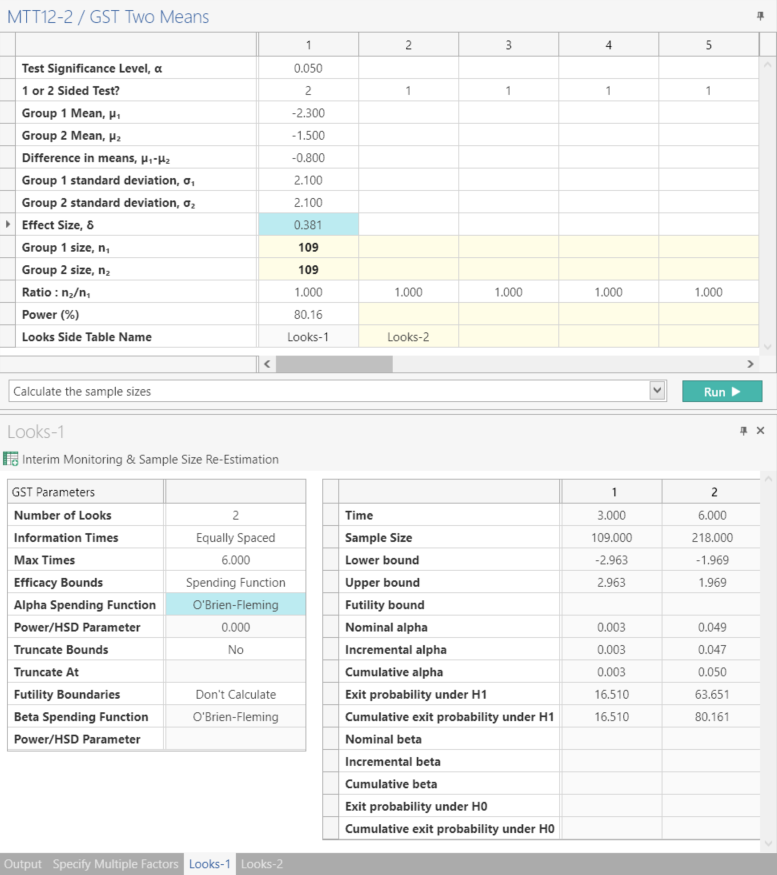
Click Run to solve for Sample Size

This analysis calculates a sample size of 109 patients per group with a power of 80.15%.


Sample Size Calculator Example- nQuery- Example 15- Img 03- Group Sequential Test of Two Means

Step 4:
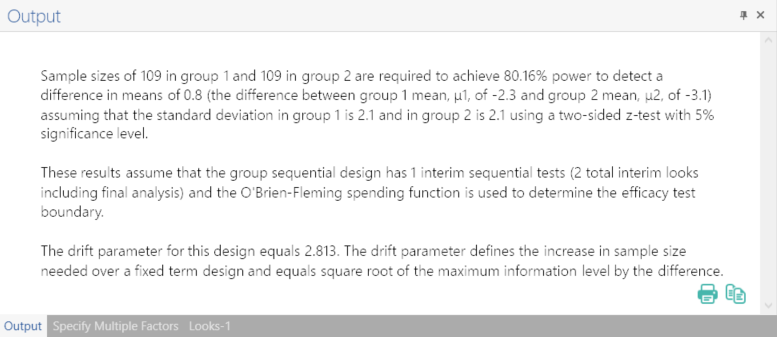
Once the calculation is completed, nQuery Advanced provides an output statement summarizing the results. It States:

Output Statement:

Sample sizes of 109 in group 1 and 109 in group 2 are required to achieve 80.16% power to detect a difference in means of -0.8 (the difference between group 1 mean, μ1, of -2.3 and group 2 mean, μ2, of -1.5) assuming that the standard deviation in group 1 is 2.1 and in group 2 is 2.1 using a two-sided z-test with 5% significance level.

These results assume that the group sequential design has 1 interim sequential tests (2 total interim looks including final analysis) and the O'Brien-Fleming spending function is used to determine the efficacy test boundary.

The drift parameter for this design equals 2.813. The drift parameter defines the increase in sample size needed over a fixed term design and equals square root of the maximum information level by the difference.


Sample Size Calculator Example- nQuery- Example 15- Img 04- Group Sequential Test of Two Means

Step 5:
Calculate the sample size adjusted for expected 10% dropout, as outlined in protocol.

Sample Size Calculator Example- nQuery- Example 15- Img 05- Group Sequential Test of Two Means

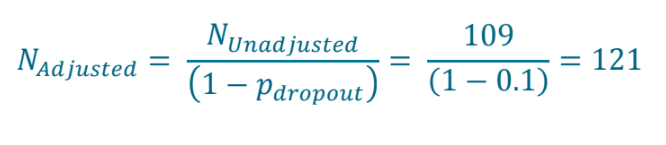
This gives a final sample size of 121 per group as per study design in protocol.


Email me this example in PDF format

Free 14 Day Trial

Demo Icon white
No download required