
Scientific intelligence platform for AI-powered data management and workflow automation


Scientific intelligence platform for AI-powered data management and workflow automation

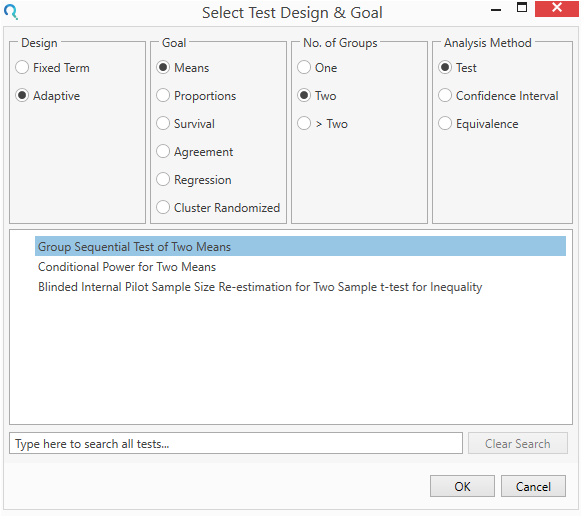
Step 1:
Select the Group Sequential Test of Two Mean Table from the Select Test Design & Goal window.
This can be done using the radio buttons or alternatively, you can use the search bar at the end of the Select Test Design & Goal window.
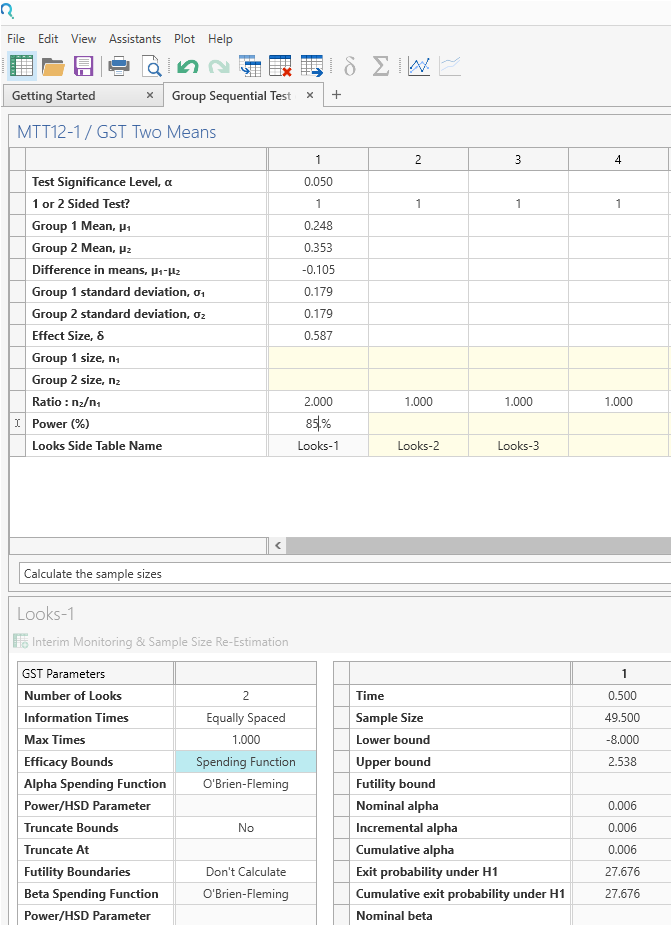
Step 2:
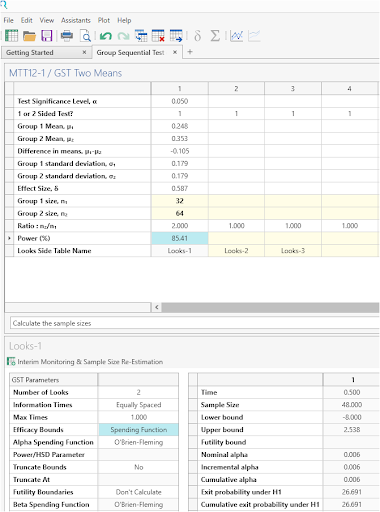
Enter the values for sample size calculation taken from the study design statement.
Setting the “Number of looks” row to 2 specifies one interim analysis and one endpoint analysis.
The O’Brien Fleming boundaries will be selected by default. No futility analysis was included in this study.
Set the standard deviation in both groups to the same value to indicate a common variances solution.
Step 3:
Click Run to solve for sample size
|
The analysis gives a sample size of 32 and 64 giving 82.4% power. The sample sizes adjusted for dropout were 36 and 72 (sample sizes divided by 0.9). This gives the total sample size of 108 given in the study design. |
Step 4:
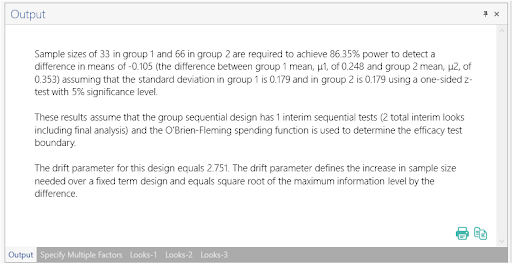
Once the calculation is completed, nQuery Advanced provides an output statement summarizing the results. It States:
| Output Statement: |
|
Sample sizes of 32 in group 1 and 64 in group 2 are required to achieve 85.41% power to detect a difference in means of -0.105 (the difference between group 1 mean, μ1, of 0.248 and group 2 mean, μ2, of 0.353) assuming that the standard deviation in group 1 is 0.179 and in group 2 is 0.179 using a one-sided z-test with 5% significance level. These results assume that the group sequential design has 1 interim sequential tests (2 total interim looks including final analysis) and the O'Brien-Fleming spending function is used to determine the efficacy test boundary. The drift parameter for this design equals 2.709. The drift parameter defines the increase in sample size needed over a fixed term design and equals square root of the maximum information level by the difference. |
Step 5:
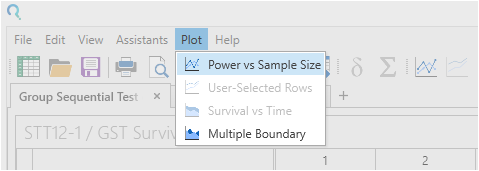
nQuery Advanced also provides graphs and the details of the interim analysis.