

Scientific intelligence platform for AI-powered data management and workflow automation


Scientific intelligence platform for AI-powered data management and workflow automation

Objective: This randomized, double-blind, placebo-controlled study evaluated dose-response relationships of lisdexamfetamine dimesylate when used as augmentation for major depressive disorder in individuals exhibiting inadequate responses to antidepressant monotherapy.
Year: 2017
Source: Journal of Psychopharmacology
Link: https://journals.sagepub.com/doi/10.1177/0269881117722998
Protocol: https://clinicaltrials.gov/ct2/show/NCT01435759
Clinical Area: Psychopharmacology
| Sample Size Section in Paper/Protocol: |
|
““Participants meeting all of the randomization criteria were randomized 1:1:1:1:1 to |
Summary of Necessary Parameter Estimates for Sample Size Calculation:
| Parameter | Value |
| Significance Level (2-Sided) | 0.1 |
| Number of Doses | 5 (0mg, 10mg, 30mg, 50mg, 70mg) |
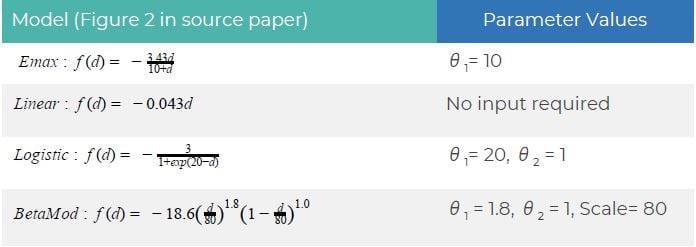
| Number of Models | 4 (Emax, Linear, Logistic, Beta) |
| Placebo Effect, δ 0 | 0.2 |
| Max Treatment Effect, δ 1 | 3 |
| Standard Deviation, σ | 8.1 |
| Power | 80% |
Step 1:
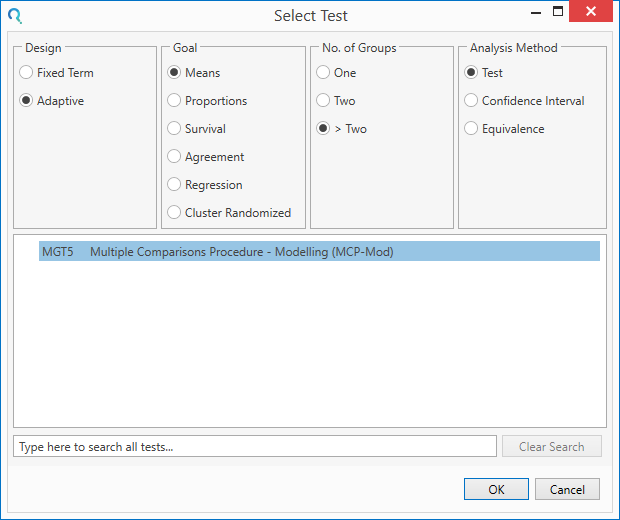
Select the MGT5 Multiple Comparisons Procedure - Modelling (MCP-Mod) table from the Select Test window.
This can be done using the radio buttons or alternatively, you can use the search bar at the end of the Select Test window.
Step 2:
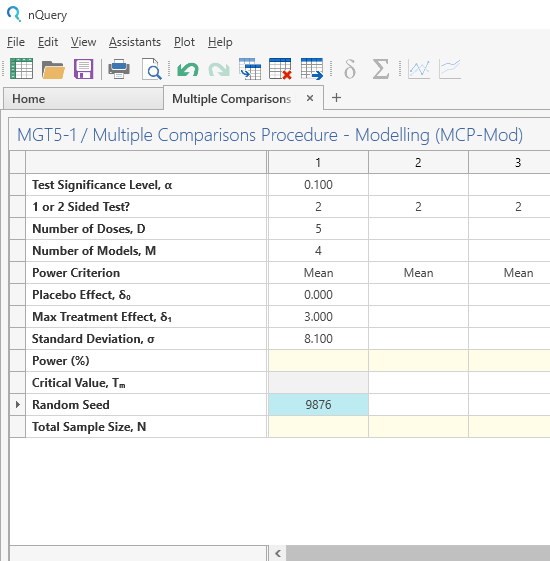
Enter the parameter values in the main table for the sample size calculation taken from the study description.
First, complete the main table. Note: Mean power criterion implies that the total power of the test will be equal to the mean power of the candidate models.
An optional random seed is also specified here to allow replicable results.
Next, complete the Dose Levels and Candidate Models side table .
 Step 3:
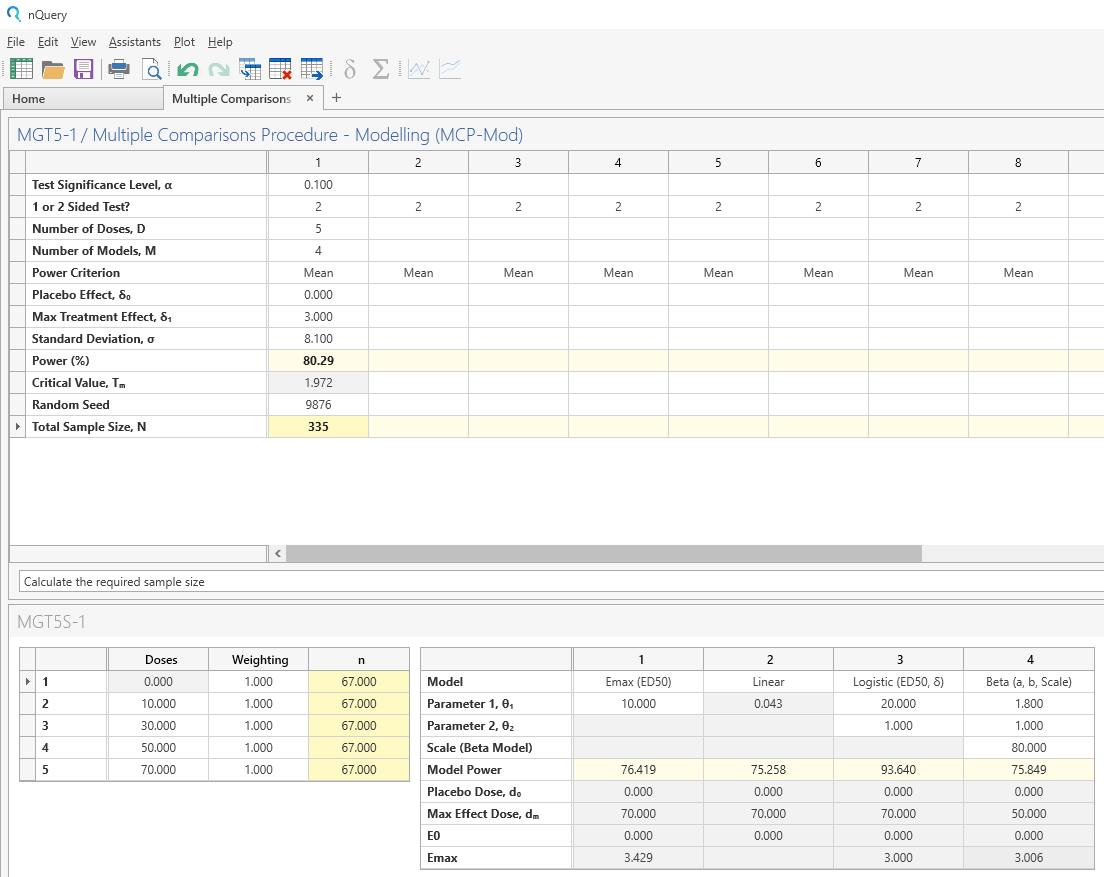
Enter the Power in the main table and the required sample size and candidate model powers will be calculated.
| The analysis gives a sample size of 67 per dose group (335 in total). A mean power of 80.29% was achieved with this sample size. The per-model powers ranged from 75.258% (Linear Model) to 93.640% (Beta Model). The maximum effect dose was the 70mg final dose for Emax, Linear and Logistic while the Beta model achieved maximum effect at the 50mg dose. |
Note that in the original study, the required sample size per dose group was calculated as 68 (340 total). This slight difference is likely due to rounding.
Step 4:
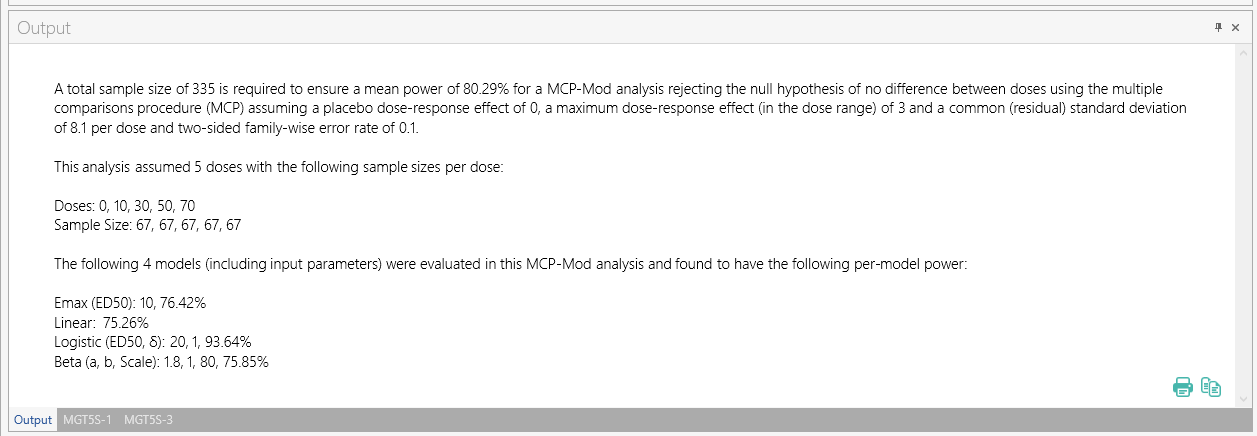
Once the calculation is completed, nQuery provides an output statement summarizing the results. It states:| Output Statement: |
|
"“ A total sample size of 335 is required to ensure a mean power of 80.29% for a MCP-Mod analysis rejecting the null hypothesis of no difference between doses using the multiple comparisons procedure (MCP) assuming a placebo dose-response effect of 0, a maximum dose-response effect (in the dose range) of 3 and a common (residual) standard deviation of 8.1 per dose and two-sided family-wise error rate of 0.1.” |
This analysis assumed 5 doses with the following sample sizes per dose:
Doses: 0, 10, 30, 50, 70
Sample Size: 67, 67, 67, 67, 67
The following 4 models (including input parameters) were evaluated in this MCP-Mod analysis and were found to have the following per-model power:
Emax (ED50): 10, 76.42%
Linear: 75.26%
Logistic (ED50, δ): 20, 1, 93.64%
Beta (a, b, Scale): 1.8, 1, 80, 75.85”
Copyright © Statsols. All Rights Reserved. Do Not Sell or Share My Personal Information. Privacy Policy .