Scientific intelligence platform for AI-powered data management and workflow automation
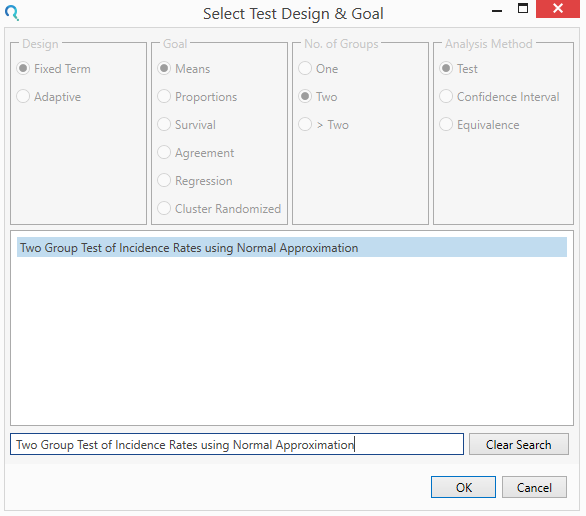
Objective: To evaluate the impact of the "flush before fill" technique on the frequency of peritonitis in children receiving automated peritoneal dialysis (APD). DESIGN: Randomized prospective multicenter study. SETTING: Participating pediatric dialysis programs of the Pediatric Peritoneal Dialysis Study Consortium.
Year: 2003
Source: Peritoneal Dialysis International
Link: http://www.pdiconnect.com/content/23/5/493.short
Clinical Area: Nephrology
Sample Size Section in Paper/Protocol: |
“Calculation of the required sample size was based on the assumption that the introduction of the flush-before-fill technique would reduce the peritonitis rate from a baseline study value of 1 infection every 12 patient months to 1 infection every 24 patient months. With a two-sided test, an alpha level of 0.05, and a power of 80%, the analysis required 48 patients per group and 566 patient months per group” |
Note: Rates are converted to years rates due to study being for 1 year.
Summary of Necessary Parameter Estimates for Sample Size Calculation:
Parameter | Value |
Significance Level (2-Sided) | 0.05 |
Expected Placebo Rate | 1 |
Expected Treatment Mean | 0.5 |
Power | 80% |
Step 1:
Select the Two Group Test of Incidence Rates using Normal Approximation table from the Select Test Design & Goal window.
This can be done using the radio buttons or alternatively, you can use the search bar at the end of the Select Test Design & Goal window.
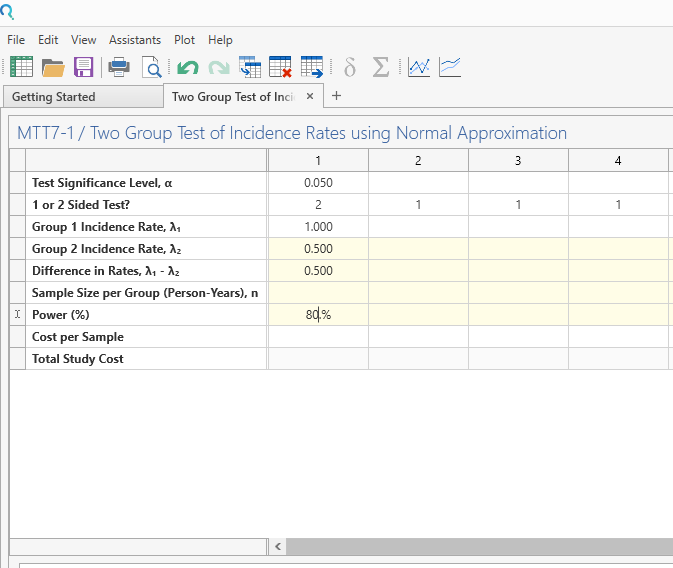
Step 2:
Enter the parameter values for sample size calculation taken from the study design.
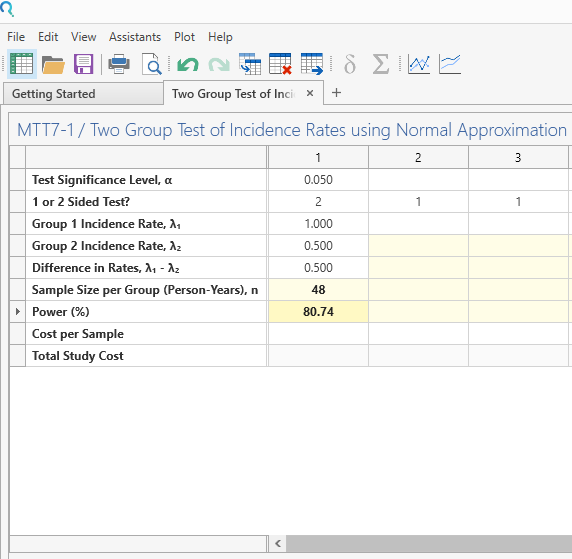
Step 3:
Select “Sample Size Calculation” and Click Run.
This gives a sample size of 48 per group (since study was one year long) with power of 80.7% |
Step 4:
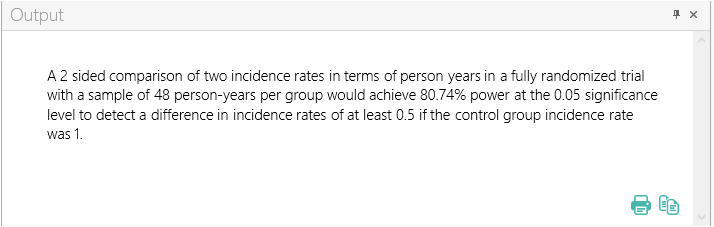
Once the calculation is completed, nQuery Advanced provides an output statement summarizing the results. It States:
Output Statement: |
A 2 sided comparison of two incidence rates in terms of person years in a fully randomized trial with a sample of 48 person-years per group would achieve 80.74% power at the 0.05 significance level to detect a difference in incidence rates of at least 0.5 if the control group incidence rate was 1. |
Copyright © Statsols. All Rights Reserved. Do Not Sell or Share My Personal Information. Privacy Policy .