
Scientific intelligence platform for AI-powered data management and workflow automation


Scientific intelligence platform for AI-powered data management and workflow automation

Objective: To investigate whether a proactive multifactorial risk factor intervention strategy using single-pill amlodipine/atorvastatin (5/10, 10/10 mg) in addition to other antihypertensive and lipid-lowering therapy, as required, resulted in greater reduction in calculated Framingham 10-year coronary heart disease (CHD) risk compared with usual care (UC) after 52-weeks treatment.
Year: 2011
Source: Current Medical Research and Opinion
Link: http://informahealthcare.com/doi/abs/10.1185/03007995.2011.555754
Clinical Area: Cardiology
| Sample Size Section in Paper/Protocol: |
|
“The detection of a 10% relative difference in the primary endpoint between the proactive intervention and UC treatment arms was translated into a difference of 0.11 in the logarithm scale. A conservative standard deviation (SD) of 0.350 was used, based on the data from the 1999 to 2000 release of NHANES23. The intraclass correlation coefficient (ICC) was used to measure the interdependence within each cluster. Previous clinical studies have reported the ICC to be in the range of 0.02–0.424, therefore an ICC of 0.2 was used as a conservative measure in the sample size calculation. Based on the above, a minimum of 132 sites and 1378 patients would provide at least 90% power to detect a 10% relative reduction in the 10-year calculated risk of total CHD after 52-weeks of treatment at a 5% significance interval. To account for a 20% drop-out rate for investigators and a 30% drop-out rate for patients, a recruitment target of 164 sites and 1968 patients was set.” |
Summary of Necessary Parameter Estimates for Sample Size Calculation:
| Parameter | Value |
| Significance Level (2-Sided) | 0.05 |
| Expected Difference in Means | 0.11 |
| Standard Deviation (Both Groups) | 0.35 |
| ICC | 0.2 |
| Average Sample Size Per Cluster | 10 |
| Power | 90% |
| Expected Investigator (Cluster) Dropout | 20% |
| Expected Patient Drop Out | 30% |
Step 1:
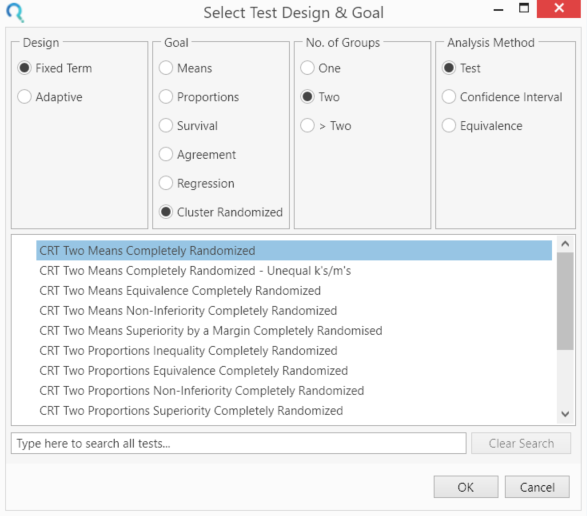
Select the CRT Two Means Completely Randomised from the Study Design Pane.
This can be done using the radio buttons or alternatively, you can use the search bar at the end of the Select Test Design & Goal window.

Step 2:
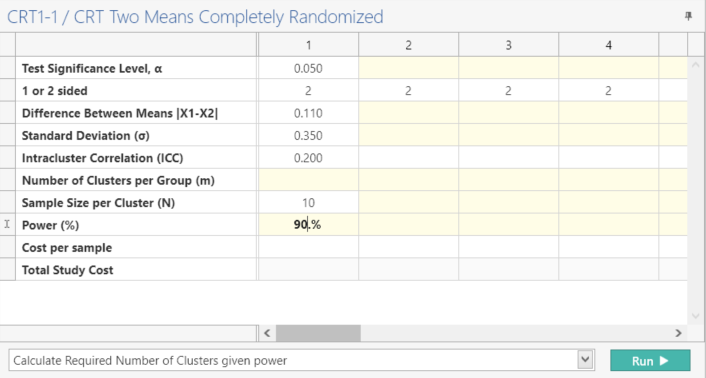
Enter the parameter values for sample size calculation taken from the study design.

Step 3:
Select “Calculate Required Number of Clusters given power” and Click Run.
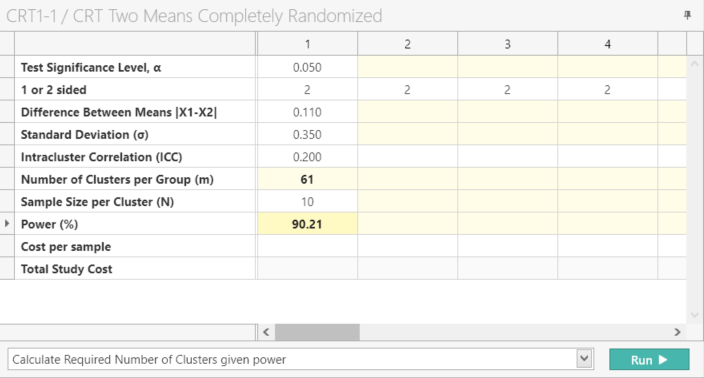
| The analysis calculates 61 clusters per group with a power of 90.214%. This gives a total of 132 clusters as per the protocol. |

Note: When using nQuery Advanced both the Number of Clusters per Group (m) will be auto calculated once all the parameter values from Step 2 are entered.
Step 4:| Output Statement: |
|
"In a cluster randomized trial comparing two continuous variables, a sample size of 61 clusters per group with 10 individuals per cluster achieves 90.21% power to detect a difference of 0.11 between the group means when the standard deviation is 0.35 and the intracluster correlation is 0.2 using a Two-Sided T-test at the 5% significance level." |

Copyright © Statsols. All Rights Reserved. Do Not Sell or Share My Personal Information. Privacy Policy .