
Scientific intelligence platform for AI-powered data management and workflow automation


Scientific intelligence platform for AI-powered data management and workflow automation

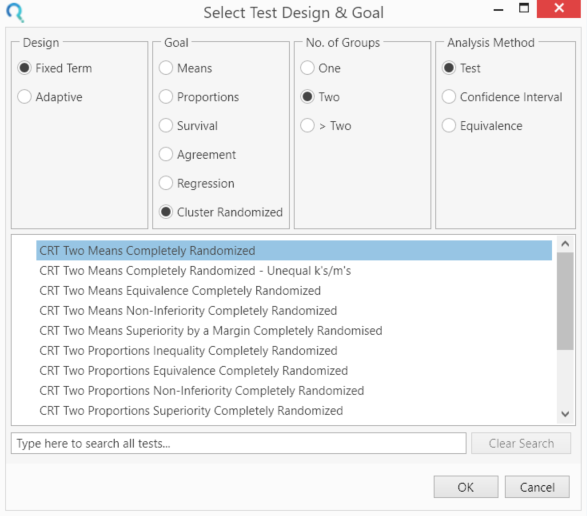
Step 1:
Select the CRT Two Means Completely Randomised from the Study Design Pane.
This can be done using the radio buttons or alternatively, you can use the search bar at the end of the Select Test Design & Goal window.
Step 2:
Enter the parameter values for sample size calculation taken from the study design.
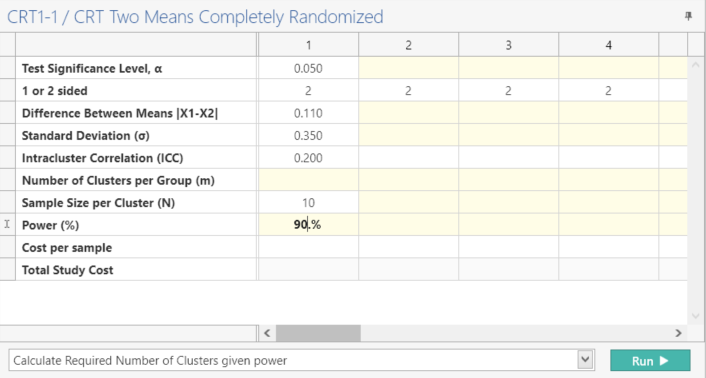
Step 3:
Select “Calculate Required Number of Clusters given power” and Click Run.
| The analysis calculates 61 clusters per group with a power of 90.214%. This gives a total of 132 clusters as per the protocol. |
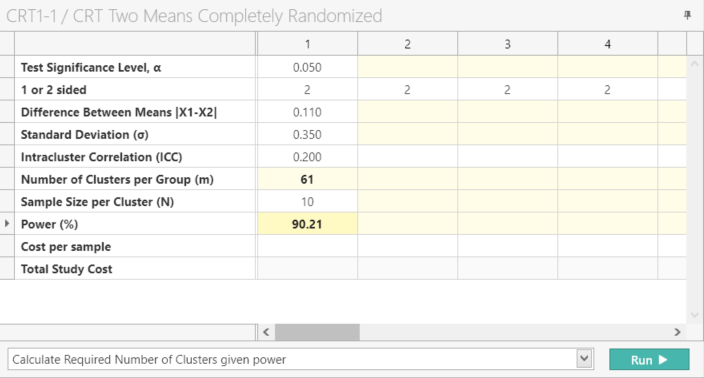
Note: When using nQuery Advanced both the Number of Clusters per Group (m) will be auto calculated once all the parameter values from Step 2 are entered.
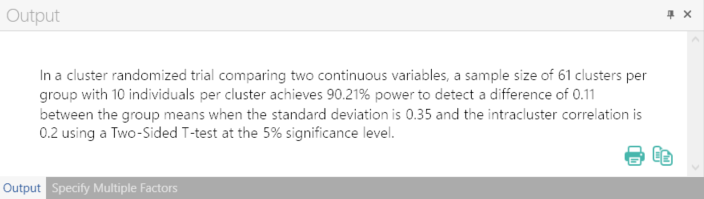
Step 4:| Output Statement: |
|
"In a cluster randomized trial comparing two continuous variables, a sample size of 61 clusters per group with 10 individuals per cluster achieves 90.21% power to detect a difference of 0.11 between the group means when the standard deviation is 0.35 and the intracluster correlation is 0.2 using a Two-Sided T-test at the 5% significance level." |