
Scientific intelligence platform for AI-powered data management and workflow automation


Scientific intelligence platform for AI-powered data management and workflow automation

Objective: To assess the efficacy and safety of glatiramer acetate (GA) 40mg administered 3× weekly (tiw) compared with placebo in patients with relapsing–remitting multiple sclerosis (RRMS).
Year: 2013
Source: Annals of Neurology
Link: https://onlinelibrary.wiley.com/doi/abs/10.1002/ana.23938
Clinical Area: Neurology
| Sample Size Section in Paper/Protocol: |
|
“A sample size of 1,350 patients (900 patients in the GA treatment group and 450 in the placebo group) was considered necessary to provide 90% power to detect a statistically significant difference in the total number of confirmed relapses between the treatment groups. The calculation accounted for an expected ARR of 0.35 in an untreated population, an expected ARR of ≤0.245 in the GA-treated population, and a dropout rate of 15%.” |
Summary of Necessary Parameter Estimates for Sample Size Calculation:
| Parameter | Value |
| Significance Level (2-Sided) | 0.05 |
| Control Rate | 0.35 |
| Rate Ratio | 0.7 |
| Dispersion Parameter | Not Given |
| Exposure Time | 1 |
| Sample Size Ratio | 2 |
| Power | 90% |
| Expected Dropout | 15% |
Step 1:
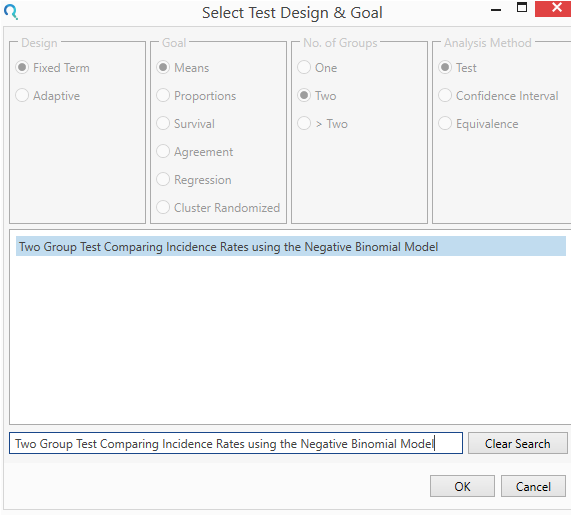
Select the Two Group Test Comparing Incidence Rates using the Negative Binomial Model table from the Select Test Design & Goal window.
This can be done using the radio buttons or alternatively, you can use the search bar at the end of the Select Test Design & Goal window.

Step 2:
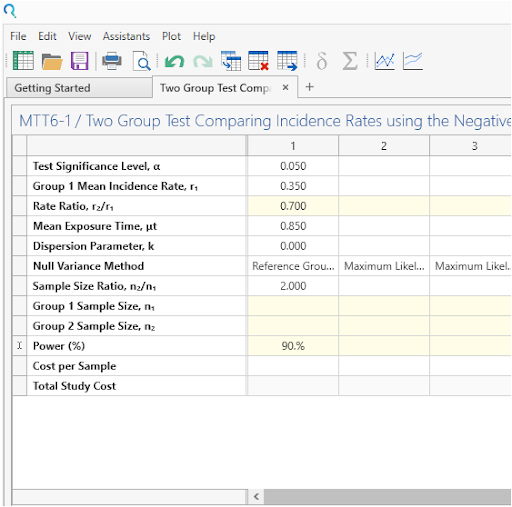
Enter the parameter values for sample size calculation taken from the study protocol.
A 15% dropout rate can be accounted for by a 15% reduction in average exposure time and thus setting exposure time to 0.85 in this example.

Step 3:
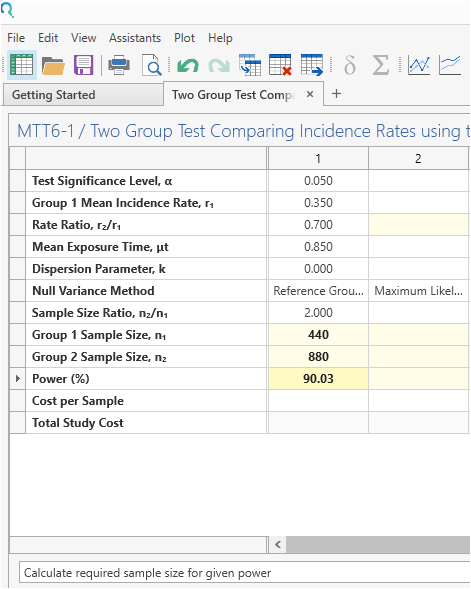
Click Run to solve for the sample size.

Step 4:
Once the calculation is completed, nQuery Advanced provides an output statement summarizing the results. It States:
| Output Statement: |
| The comparison of two event (incidence) rates using a Negative Binomial model with a group 1 sample size of 440 and a group 2 sample size of 880 achieves 90.03% power at the 0.05 significance level when the mean incidence rate in group 1 is 0.35 and the rate ratio is 0.7. This assumes the mean exposure time was 0.85 and the two groups have a common dispersion parameter of 0. This assumes the variance under the null hypothesis was calculated using the (Control Group Rate/True Rates/Maximum Likelihood) method. |

Copyright © Statsols. All Rights Reserved. Do Not Sell or Share My Personal Information. Privacy Policy .