Explore the Scientific R&D Platform

Try Now
Pricing
MENU
Try Now
Pricing

Sample Size Determination Example

AREA: Means | Respiratory

nQuery In Use Background Web  Opacity 35

GSK Chronic obstructive pulmonary disease (COPD) Research

TitleOnce daily inhaled fluticasone furoate and vilanterol versus vilanterol only for prevention of exacerbations of COPD:
Two replicate double blind, parallel-group, randomised controlled trials

Objective: Whether the combination of a once-daily inhaled corticosteroid with a once-daily longacting β2 agonist is more protective than a once-daily longacting β2 agonist alone against exacerbations of chronic obstructive pulmonary disease (COPD) is unknown. We hypothesised that fluticasone furoate and vilanterol would prevent more exacerbations than would vilanterol alone.

Year: 2013

Source: Lancet Respiratory Medicine

Link: https://www.sciencedirect.com/science/article/abs/pii/S2213260013700407

Clinical Area: Respiratory

Sample Size Section in Paper/Protocol:

“On the basis of previous studies of fluticasone propionate–salmeterol combinations we assumed a yearly exacerbation rate with vilanterol of 1·4 and a dispersion parameter of 0·7. Thus, we calculated that a sample size of 390 assessable patients per group in each study would provide each study with 90% power to detect a 25% reduction in exacerbations in the fluticasone furoate and vilanterol groups versus the vilanterol only group at a two-sided 5% significance level”


Summary of Necessary Parameter Estimates for Sample Size Calculation:

 Parameter Value
 Significance Level (2-Sided) 0.05
 Control Rate 1.4
 Rate Ratio 0.75
 Dispersion Parameter 0.7
 Exposure Time (Years) 1
Power 90%

Email me this example in PDF format

Step 1:
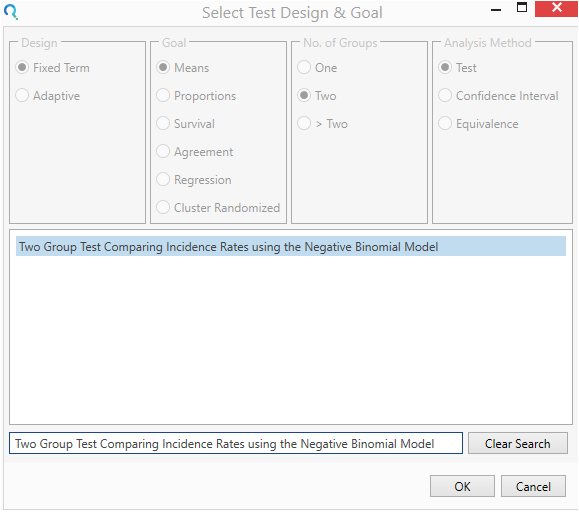
Select the Two Group Test Comparing Incidence Rates using the Negative Binomial Model from the Select Test Design & Goal window.

This can be done using the radio buttons or alternatively, you can use the search bar at the end of the Select Test Design & Goal window.

Sample Size Calculator Example- nQuery- Example 13- Img 01- Two Group Test Comparing Incidence Rates using the Negative Binomial Model


Step 2:
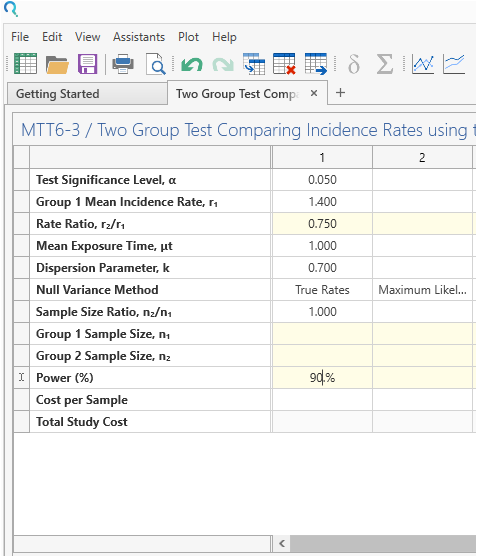
Enter the parameter values for sample size calculation taken from the study description.

Sample Size Calculator Example- nQuery- Example 13- Img 02- Two Group Test Comparing Incidence Rates using the Negative Binomial Model

Step 3:
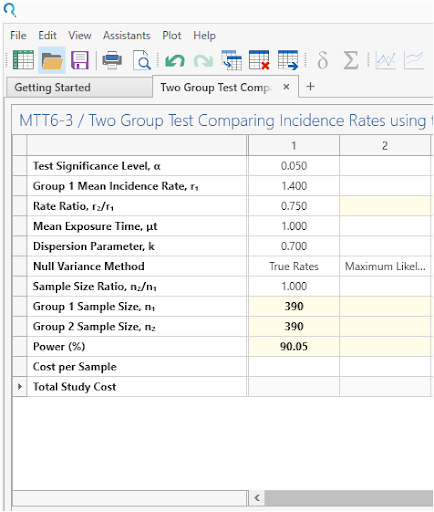
Select Run to calculate for sample size.

The analysis calculates a sample size of 390 per group with 90.05% power,
as per the study.


Sample Size Calculator Example- nQuery- Example 13- Img 03- Two Group Test Comparing Incidence Rates using the Negative Binomial Model

Step 4:
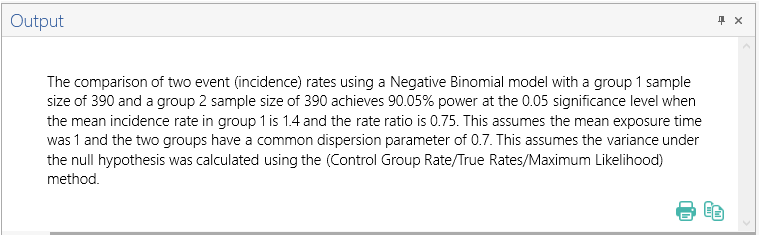
Once the calculation is completed, nQuery Advanced provides an output statement summarizing the results. It States:

Output Statement:

The comparison of two event (incidence) rates using a Negative Binomial model with a group 1 sample size of 390 and a group 2 sample size of 390 achieves 90.05% power at the 0.05 significance level when the mean incidence rate in group 1 is 1.4 and the rate ratio is 0.75. This assumes the mean exposure time was 1 and the two groups have a common dispersion parameter of 0.7. This assumes the variance under the null hypothesis was calculated using the (Control Group Rate/True Rates/Maximum Likelihood) method


Sample Size Calculator Example- nQuery- Example 13- Img 04- Two Group Test Comparing Incidence Rates using the Negative Binomial Model

Email me this example in PDF format

Free 14 Day Trial

Demo Icon white
No download required