
Scientific intelligence platform for AI-powered data management and workflow automation


Scientific intelligence platform for AI-powered data management and workflow automation

Objective: In patients with ST elevation myocardial infarction (STEMI) increased platelet reactivity has been described to affect the primary percutanuous coronary intervention (PPCI) outcome. We aimed to evaluate the predictive accuracy of intrinsic platelet reactivity for intracoronary thrombus burden in P2Y12 inhibitor- naïve STEMI patients.
Year: 2013
Source: Thrombosis Research
Link: http://www.sciencedirect.com/science/article/pii/S0049384813000546
Clinical Area: Cardiology
| Sample Size Section in Paper/Protocol: |
|
“The predictive accuracy of intrinsic PR for the presence of high thrombus burden was assessed by Receiver Operating Characteristic (ROC) analysis. Power analysis was performed with a two-sided z-test [12]. A sample of 59 patients from the high thrombus burden (HTB) group and 24 patients from the low thrombus burden (LTB) group (assuming an allocation ratio HTB group/LTB group of 2.5:1, based on our own preliminary data) would suffice for a 85% power to detect a difference of 0.2 between the area under the curve (AUC), under the null hypothesis of AUC = 0.5 (no diagnostic accuracy) and the alternative hypothesis of AUC = 0.7 (moderate diagnostic accuracy), at a significance level of 0.05.” |
Summary of Necessary Parameter Estimates for Sample Size Calculation:
| Parameter | Value |
| Significance Level | 0.05 |
| Discrete or Continuous | Continuous |
| Null Hypothesis AUC | 0.05 |
| Alternative Hypothesis AUC | 0.07 |
| Sample Size Ratio | 0.4 |
| Power | 85 |
Step 1:
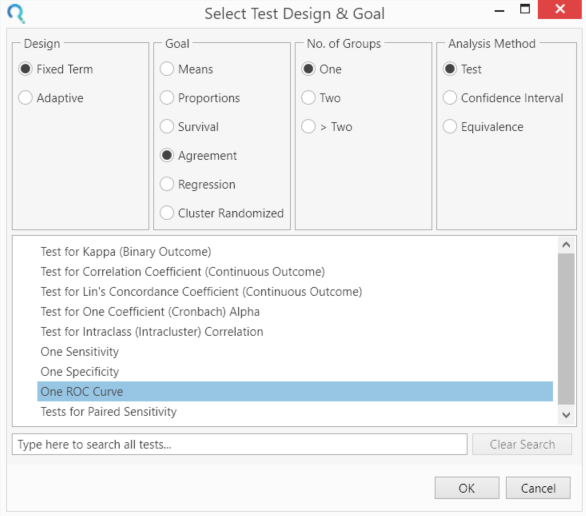
Select the ‘One ROC Curve’ table from the Select Test Design & Goal window as pictured below.
This can be done using the radio buttons or alternatively, you can use the search bar at the end of the Select Test Design & Goal window.

Step 2:
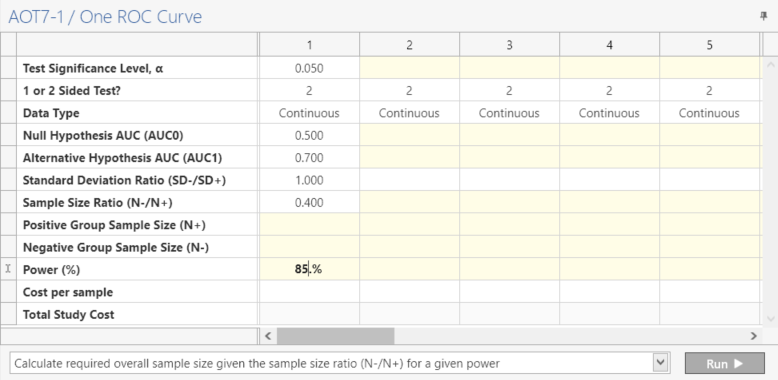
Enter the parameter values for sample size calculation taken from the study design.

Step 3:
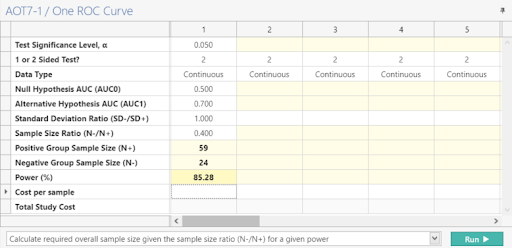
Select “Calculate required overall sample size given the sample size ratio (N-/N+) for a given power”, click the “Run” button to solve for the sample size.
| This gives a sample size of 59 positive cases and 29 negative cases as per the study Design |

Note: When using nQuery Advanced, both the Positive and Negative Sample Size will be auto-calculated once the Power (%) value is entered.
Step 4:
Once the calculation is completed, nQuery Advanced provides an output statement summarizing the results. It States:
| Output Statement: |
|
“In a two sided test comparing the area under the ROC curve (AUC) to a reference value for continuous response data using a z-test approximation, a sample size of 59 from the positive group (with the condition) and a sample size of 24 from the negative group (without the condition) achieves 85.28% power at the 5% significance level when the AUC under the null hypothesis is 0.5 and the AUC under the alternative hypothesis is 0.7.” |

Copyright © Statsols. All Rights Reserved. Do Not Sell or Share My Personal Information. Privacy Policy .