

Scientific intelligence platform for AI-powered data management and workflow automation


Scientific intelligence platform for AI-powered data management and workflow automation

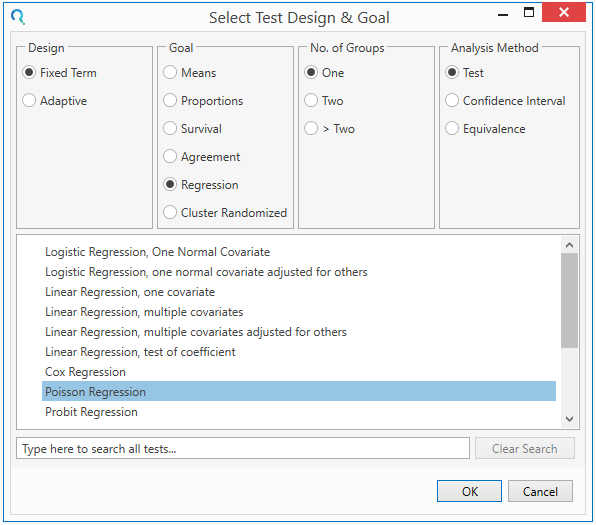
Step 1:
Select the “Poisson Regression” table from the Select Test Design & Goal window.
This can be done using the radio buttons or alternatively, you can use the search bar at the end of the Select Test Design & Goal window.
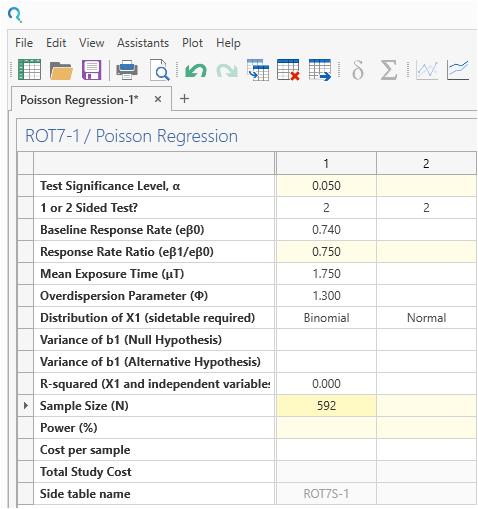
Step 2:
Enter the parameter values for the power calculation taken from the study protocol
Remember to enter “0” in the R-squared field.
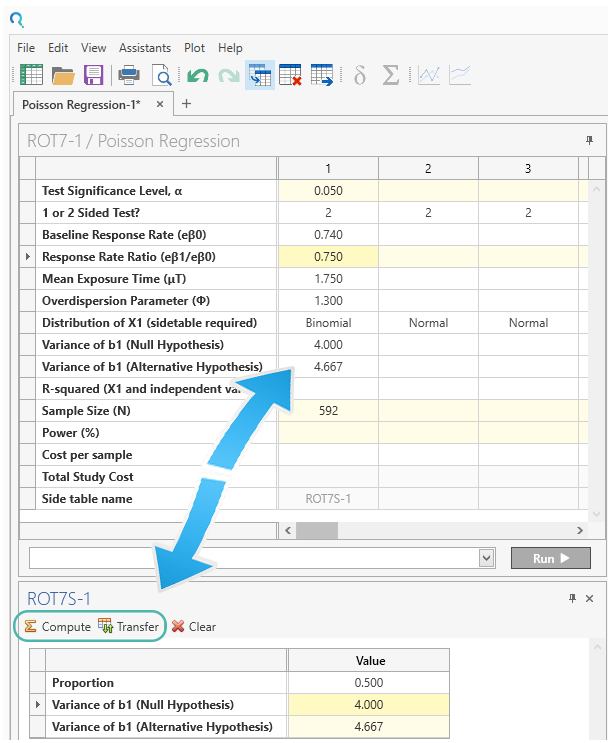
Step 3:
Enter 0.5 for “Proportion” in the binomial side table.
Click “Compute” to calculate the coefficient variances.
Then click “Transfer” to transfer them main table
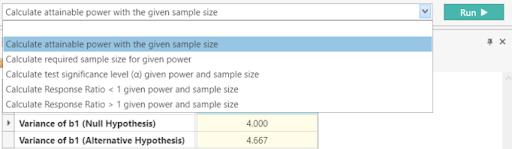
Step 4:
Beneath the table, select “Calculate attainable power with the given sample size” from the dropdown menu and click Run.
|
This gives a power of 92.2%. This is different from the stated power of 94%. However, based on the study protocol of the related TEMSO study and FDA Reviews, the power was originally calculated using a Mann-Whitney U test rather than using the Poisson Regression assumptions appropriate for the methodology used in this study. Using a sample size calculation designed for the actual statistical methodology is usually preferred. |
