
Scientific intelligence platform for AI-powered data management and workflow automation


Scientific intelligence platform for AI-powered data management and workflow automation

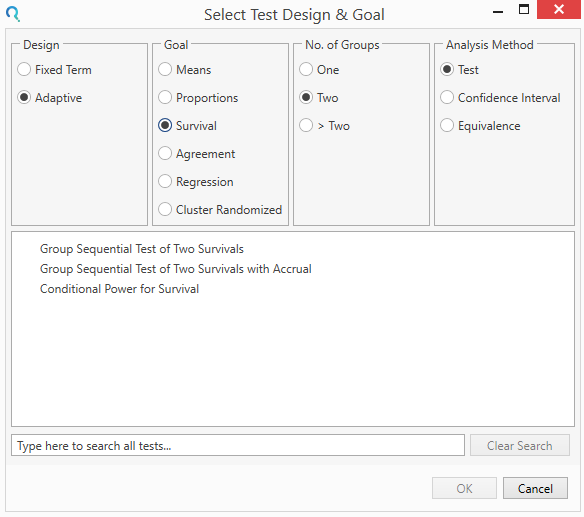
Step 1:
Select the Group Sequential Test of Two Survivals Table from the Study Design Pane.
This can be done using the radio buttons or alternatively, you can use the search bar at the end of the Select Test Design & Goal window.
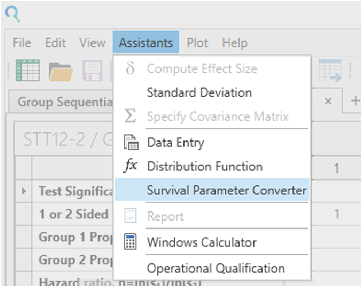
Step 2:
From the Assistants menu select Survival Parameter Converter.
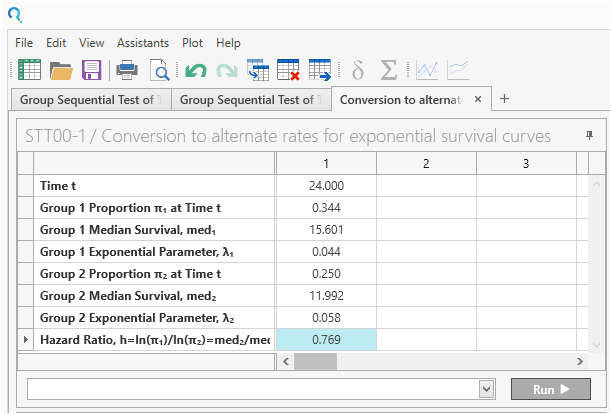
Convert the median survival time and hazard ratio into “Group Proportion at Time t”
Step 3:
Enter the values for sample size calculation taken from the study design statement and survival parameter converter.
Be sure to change the Number of Looks from the default to “2”. This specifies one interim analysis and one endpoint analysis.
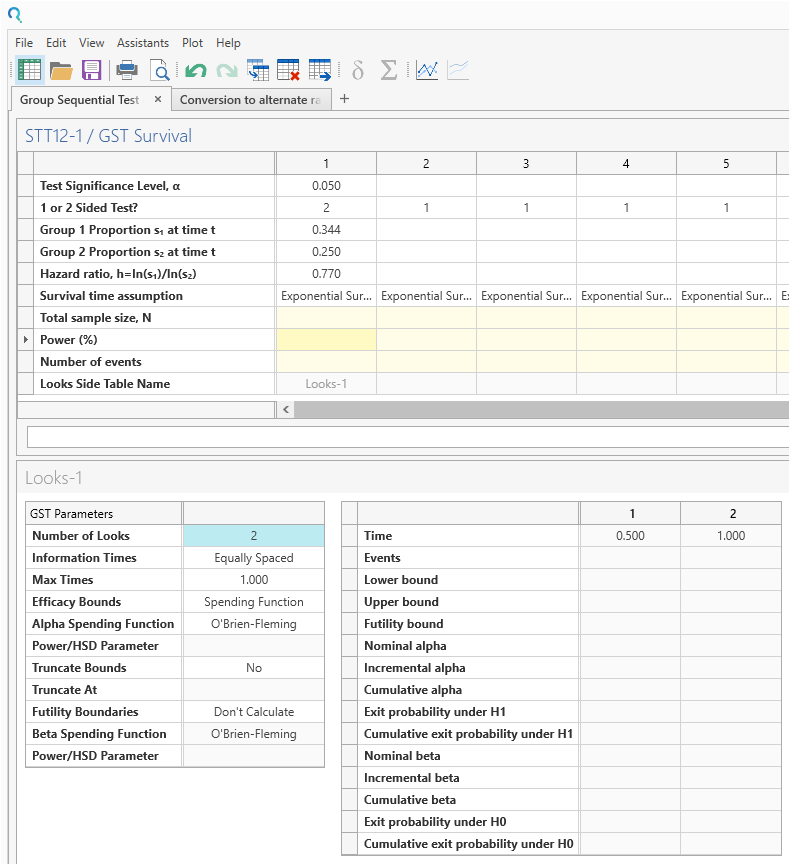
Now enter the Power of 80% and the sample size and number of events will auto calculate.
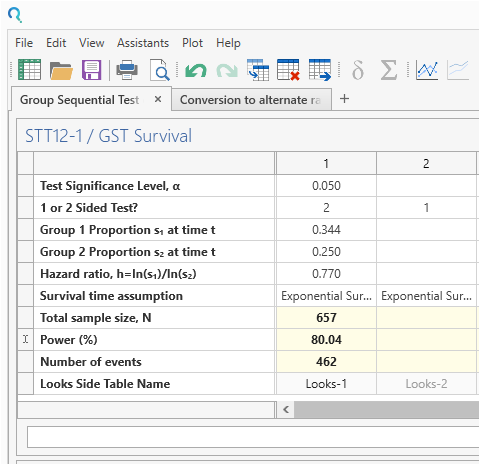
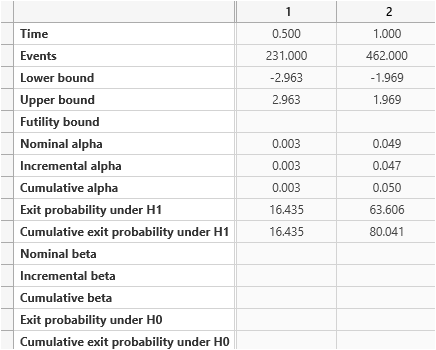
| The analysis calculates a sample size of 462 events with a power of 80% as per the study design statement. The difference of one may be due to rounding or the authors using simulation methods. |
The total sample size used in the study was 800, which was estimated to provide 87.2% power in this study. This sample size may have been adjusted for accrual time and/or dropout.
Step 4:
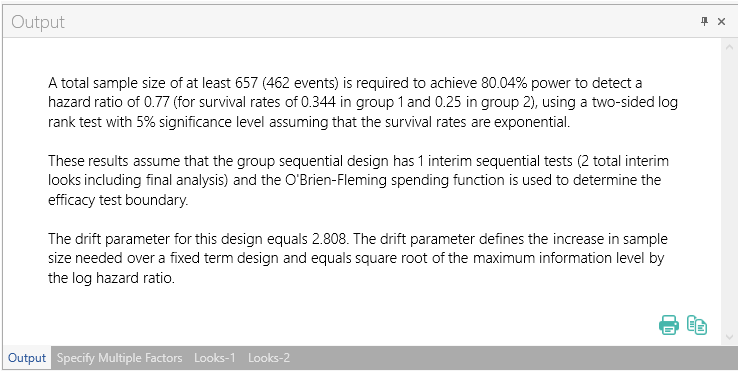
Once the calculation is completed, nQuery Advanced provides an output statement summarizing the results. It States:
| Output Statement: |
|
A total sample size of at least 657 (462 events) is required to achieve 80.04% power to detect a hazard ratio of 0.77 (for survival rates of 0.344 in group 1 and 0.25 in group 2), using a two-sided log rank test with 5% significance level assuming that the survival rates are exponential. These results assume that the group sequential design has 1 interim sequential tests (2 total interim looks including final analysis) and the O'Brien-Fleming spending function is used to determine the efficacy test boundary. The drift parameter for this design equals 2.808. The drift parameter defines the increase in sample size needed over a fixed term design and equals square root of the maximum information level by the log hazard ratio |
The output statement appears at the bottom of nQuery. This can be printed or copy and pasted into any document.
Step 5:
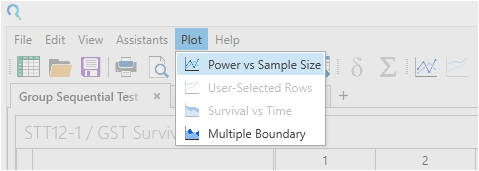
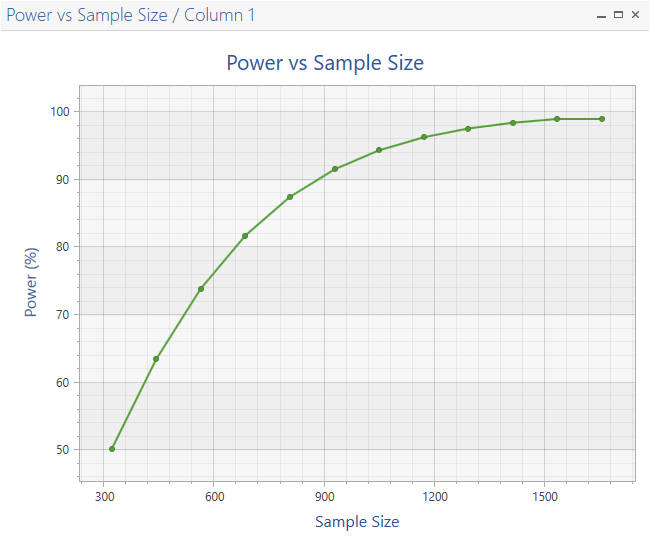
nQuery Advanced also provides graphs and the details of the interim analysis.
To access plots, go to the menu and select Plot > Your graph