
Scientific intelligence platform for AI-powered data management and workflow automation


Scientific intelligence platform for AI-powered data management and workflow automation

Objective: In this randomized, double-blind trial, we compared apixaban (at a dose of 5mg twice daily) with warfarin (target international normalized ratio, 2.0 to 3.0) in 18,201 patients with atrial fibrillation and at least one additional risk factor for stroke. The primary outcome was ischemic or hemorrhagic stroke or systemic embolism. The trial was designed to test for noninferiority, with key secondary objectives of testing for superiority with respect to the primary outcome and to the rates of major bleeding and death from any cause.
Year: 2011
Source: New England Journal of Medicine
Link: http://www.nejm.org/doi/full/10.1056/NEJMoa1107039
Clinical Area: Cardiology
| Sample Size Section in Paper/Protocol: |
|
''The primary non inferiority hypothesis required that apixaban preserve at least 50% of the relative reduction in the risk of stroke or systemic embolism associated with warfarin (62%) in six previous, major randomized, controlled trials.10 This hypothesis provided a lower 95% confidence interval of 1.88 for the relative risk with placebo as compared with warfarin, and one half of this value was 1.44 (or 1.38 on a log scale). |
From Protocol: Incidence rate = 1.2 events per hundred person-years
Average Follow-up = 2.1 years | Expected Dropout = 1%
Note: Only the 99% confidence interval with 1.44 relative risk analysis replicated since protocol states this was analysis with higher sample size.
Summary of Necessary Parameter Estimates for Sample Size Calculation:
| Parameter | Value |
| Significance Level (1-Sided) | 0.005 |
| Non-Inferiority Margin | 1.44 |
| Power | 90% |
| Incidence Rate per Year | 0.012 |
| Average Follow-Up (Years) | 2.1% |
| Expected Dropout | 1% |
Step 1:
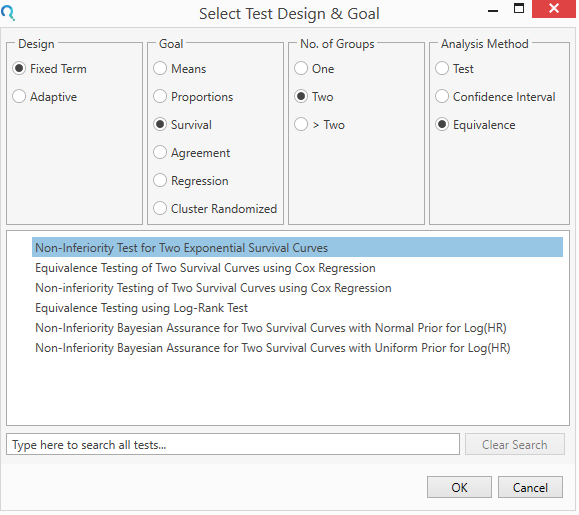
Select the Non-inferiority test for Two Exponential Survival Curves from the Select Test Design & Goal window.
This can be done using the radio buttons or alternatively, you can use the search bar at the end of the Select Test Design & Goal window.

Step 2:
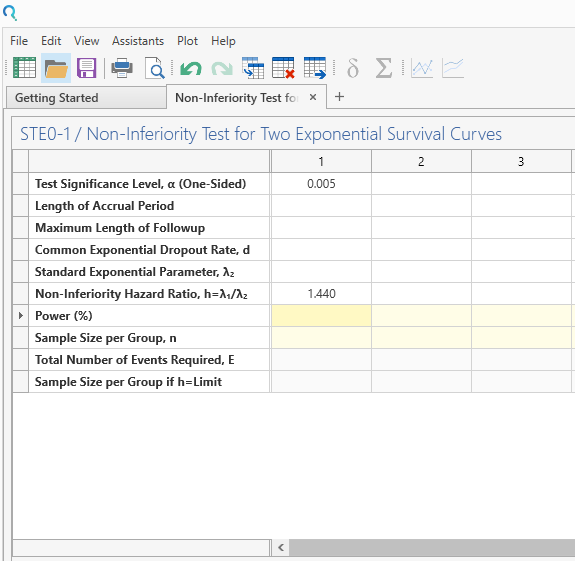
Enter the parameter values for sample size calculation taken from the study protocol

Step 3:
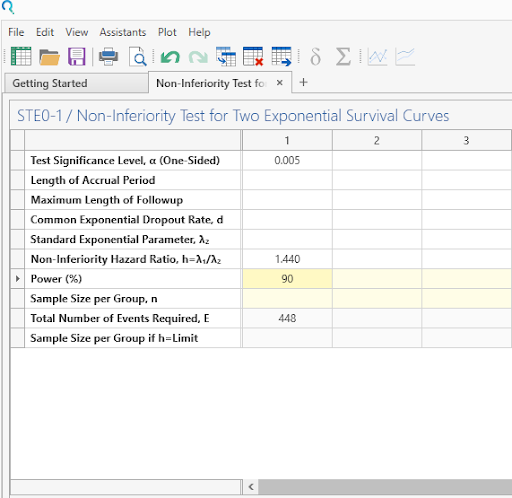
Once Power is entered, sample size is calculated automatically.
| This gives a number of events of 448, as per the study protocol. |

Step 4:
Calculate the sample size based on the number of events, the incidence rate and the average follow up period.

Adjust sample size for 1% dropout rate

| This gives approximately 18000 as per the protocol |
Copyright © Statsols. All Rights Reserved. Do Not Sell or Share My Personal Information. Privacy Policy .