

Scientific intelligence platform for AI-powered data management and workflow automation


Scientific intelligence platform for AI-powered data management and workflow automation

Objective: In Japan and South Korea, transarterial chemoembolisation (TACE) is an important locoregional treatment for patients with unresectable hepatocellular carcinoma (HCC). Sorafenib, a multikinase inhibitor, has been shown effective and safe in patients with advanced HCC. This phase III trial assessed the efficacy and safety of sorafenib in Japanese and Korean patients with unresectable HCC who responded to TACE.
Year: 2011
Source: New England Journal of Cancer
Link: https://www.sciencedirect.com/science/article/pii/S0959804911003248
Clinical Area: Oncology
| Sample Size Section in Paper/Protocol: |
|
“Patient sample size was estimated based on TTP. If 30% and 70% of patients achieved CR and non-CR, respectively, in response to TACE, the median TTP for the placebo group in the mixed population would be 5.7 months. Clinically meaningful improvement was defined as median TTP 50% higher in the sorafenib than in the placebo group. |
Summary of Necessary Parameter Estimates for Sample Size Calculation:
| Parameter | Value |
| Significance Level | 0.05 |
| Expected Placebo Median Survival | 5.7 Months |
| Expected Hazard Ratio | 1.5 |
| Accrual Period | 18 Months |
| Maximum Follow Up Time | 30 Months |
| Power | 95% |
| Number of Interim Analyses | 1 |
| Alpha Spending Function (from Protocol) |
O'Brien-Fleming |
Step 1:
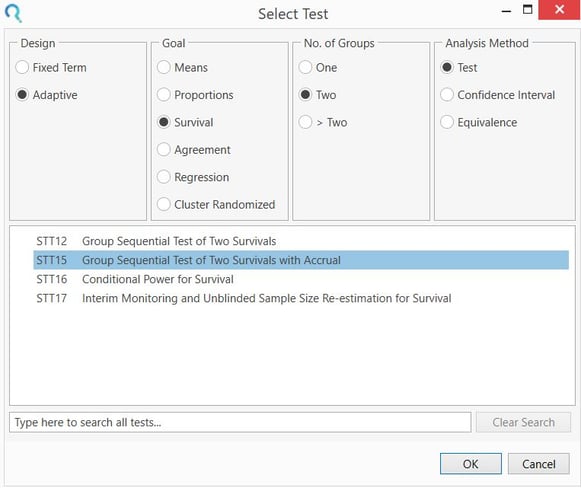
Select the Group Sequential Test of Two Survivals with Accrual (STT15) table from the Study Design Pane.
This can be done using the radio buttons or alternatively, you can use the search bar at the end of the Select Test Design & Goal window.
Step 2:
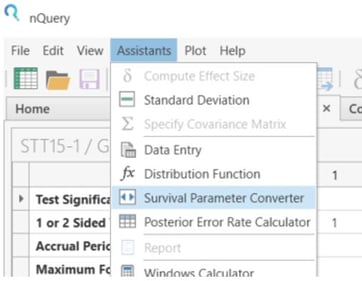
From the Assistants menu select Survival Parameter Converter.
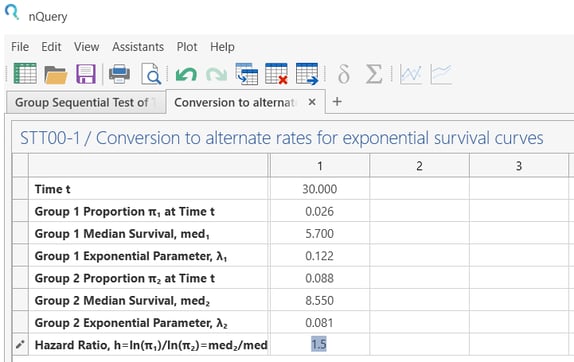
Convert the median survival time and hazard ratio into ‘’Group Exponential Parameter".
Step 3:
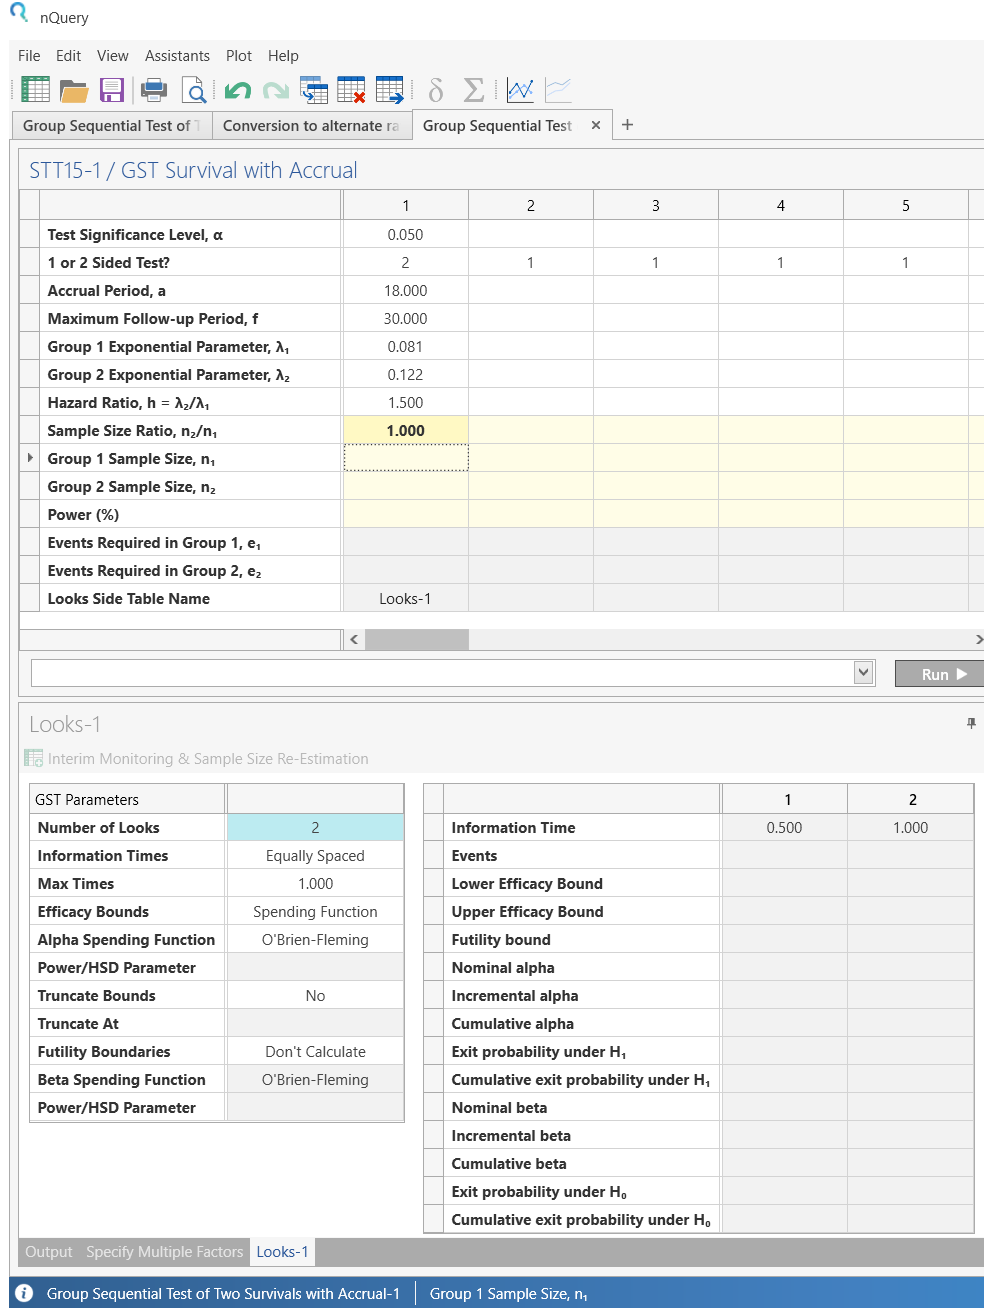
Back in table STT15, enter the values for sample size calculation taken from the study design statement.
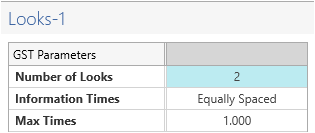
At the bottom of the table, be sure to change the Number of Looks from the default to “2”. This specifies one interim analysis and one endpoint analysis.
Step 4:
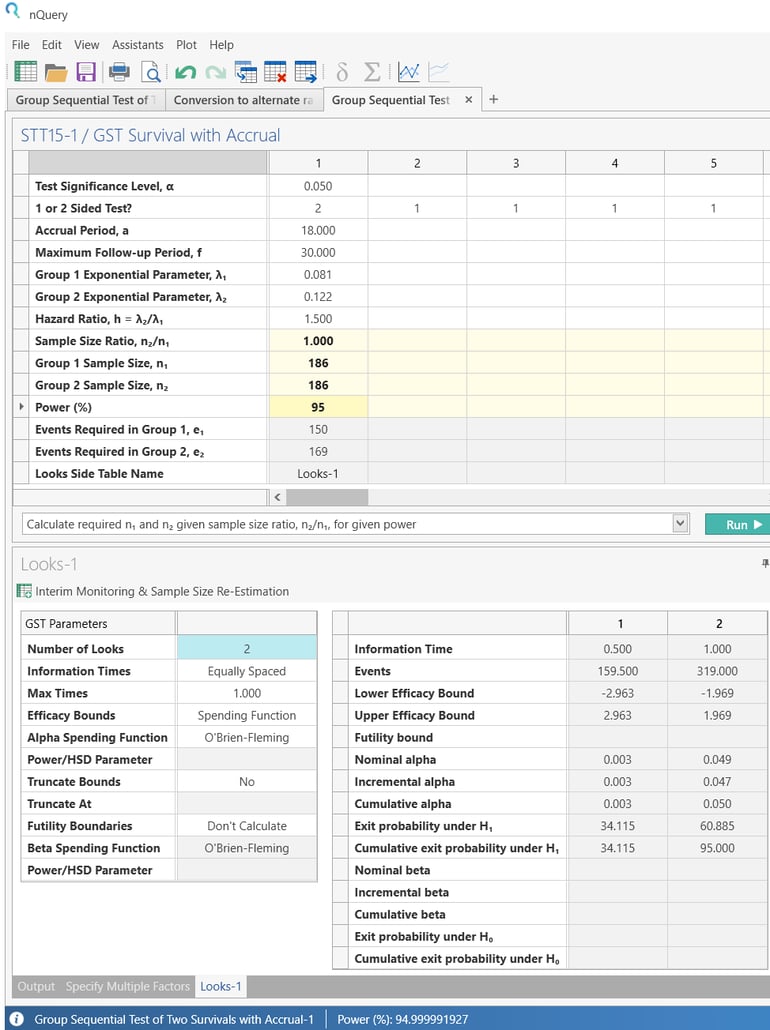
Now enter the power 95% and click Run.
The sample size and number of events will auto calculate.
|
|
Step 5:
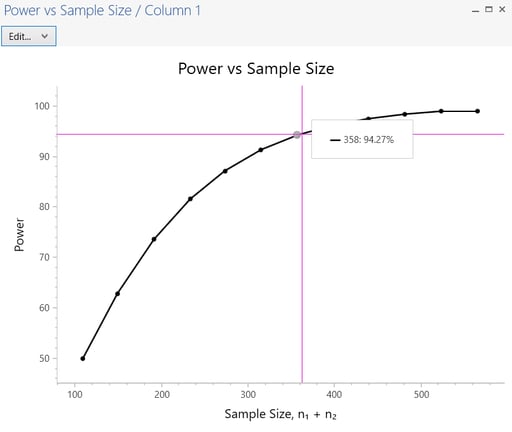
nQuery Advanced also provides graphs. The sample size and number of events will auto calculate. To access plots, go to the menu and select Plot > Your graph
Step 6:
Calculate the sample size adjusted for expected 10% dropout

| This gives a final sample size of 414 per group as per study design statement |
Copyright © Statsols. All Rights Reserved. Do Not Sell or Share My Personal Information. Privacy Policy .