
Scientific intelligence platform for AI-powered data management and workflow automation


Scientific intelligence platform for AI-powered data management and workflow automation

Objective: Oral cholera vaccines consisting of killed whole cells have been available for many years, but they have not been used extensively in populations with endemic disease. An inexpensive, locally produced oral killed-whole-cell vaccine has been used in high-risk areas in Vietnam. To expand the use of this vaccine, it was modified to comply with WHO standards. We assessed the efficacy and safety of this modified vaccine in a population with endemic cholera.
Year: 2009
Source: The Lancet
Link: http://www.sciencedirect.com/science/article/pii/S0140673609612976
Clinical Area: Immunology
| Sample Size Section in Paper/Protocol: |
|
“In our original sample size calculation, we wished to detect a protective efficacy against cholera of 50% or more with an onset from 14 days after receipt of the second dose, at p<0·05 (one-tailed) and with 80% power or more in a per-protocol (PP) analysis of the data. We assumed a risk of cholera in the placebo group of 1·2 episodes per 1000 population, losses to follow-up of 10%, and no design effect from cluster randomisation. The last assumption was made because lead-in surveillance for cholera in the study site showed no clustering of cholera within residential dwellings (intracluster correlation coefficient −0·0085). With these assumptions, about 33 000 recipients of two doses were needed in each treatment group.” |
Summary of Necessary Parameter Estimates for Sample Size Calculation:
| Parameter | Value |
| Significance Level (1-sided) | 0.05 |
| Expected Placebo Rate | 0.0012 |
| Expected Treatment Rate | 0.0006 |
| Sample Size (Adjusted for 10% Dropout) | 29700 |
Step 1:
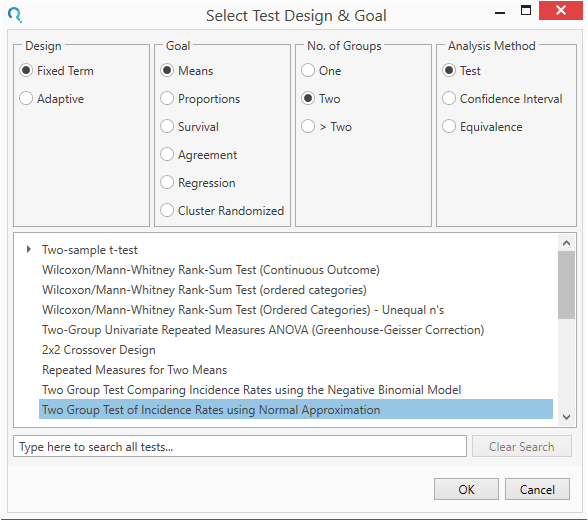
Select the Two Group Incidence Rates using Normal Approximation table from the Select Test Design & Goal window.
This can be done using the radio buttons or alternatively, you can use the search bar. at the end of the Select Test Design & Goal window.

Step 2:
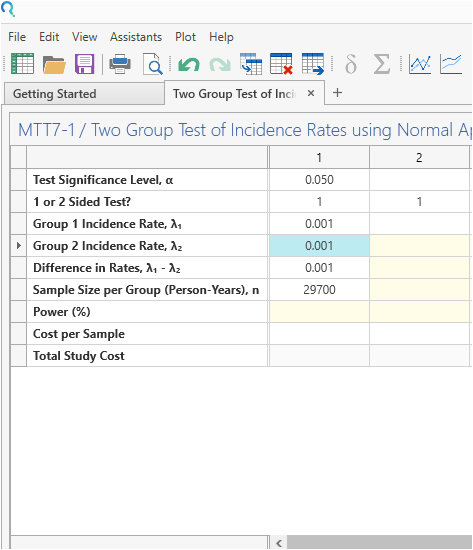
Enter the parameter values for the power calculation taken from the study design.

Step 3:
Click Run.
| The analysis gives a power of 78.6%, which is very close to the targeted power of 80% |

Note: The slight decrease in power could be due to different assumptions regarding the test statistic used.For example, in our Two Poisson Means table there are five different test statistics for testing the ratio of two incidence rates.
Step 4:
Once the calculation is completed, nQuery Advanced provides an output statement summarizing the results. It States:
| Output Statement: |
|
A 1 sided comparison of two incidence rates in terms of person years in a fully randomized trial with a sample of 29700 person-years per group would achieve 78.59% power at the 0.05 significance level to detect a difference in incidence rates of at least 0.001 if the control group incidence rate was 0.001. |

Copyright © Statsols. All Rights Reserved. Do Not Sell or Share My Personal Information. Privacy Policy .