
Scientific intelligence platform for AI-powered data management and workflow automation


Scientific intelligence platform for AI-powered data management and workflow automation

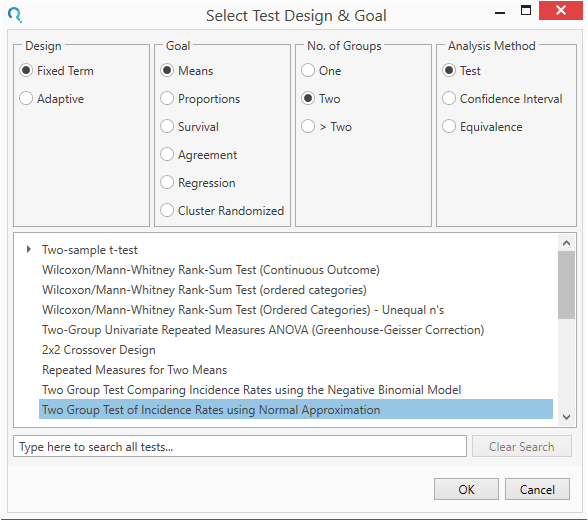
Step 1:
Select the Two Group Incidence Rates using Normal Approximation table from the Select Test Design & Goal window.
This can be done using the radio buttons or alternatively, you can use the search bar. at the end of the Select Test Design & Goal window.
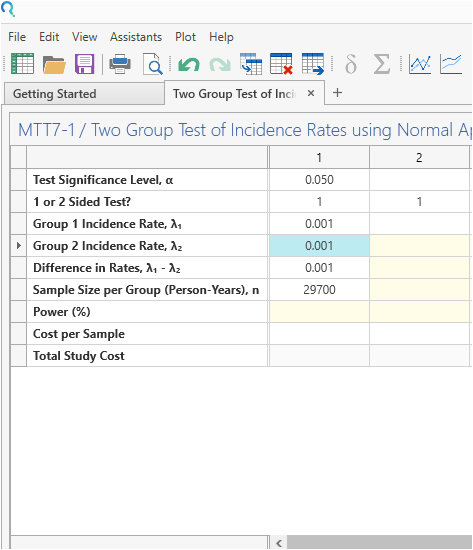
Step 2:
Enter the parameter values for the power calculation taken from the study design.
Step 3:
Click Run.
| The analysis gives a power of 78.6%, which is very close to the targeted power of 80% |

Note: The slight decrease in power could be due to different assumptions regarding the test statistic used.For example, in our Two Poisson Means table there are five different test statistics for testing the ratio of two incidence rates.
Step 4:
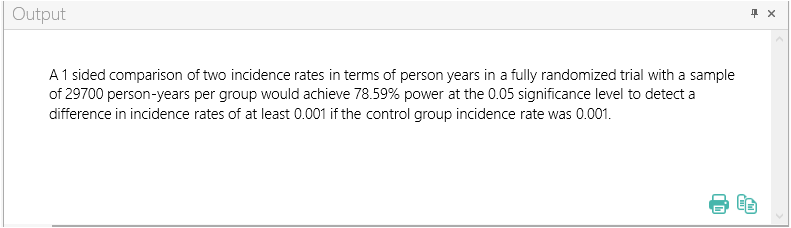
Once the calculation is completed, nQuery Advanced provides an output statement summarizing the results. It States:
| Output Statement: |
|
A 1 sided comparison of two incidence rates in terms of person years in a fully randomized trial with a sample of 29700 person-years per group would achieve 78.59% power at the 0.05 significance level to detect a difference in incidence rates of at least 0.001 if the control group incidence rate was 0.001. |