

Scientific intelligence platform for AI-powered data management and workflow automation


Scientific intelligence platform for AI-powered data management and workflow automation

Step 1:
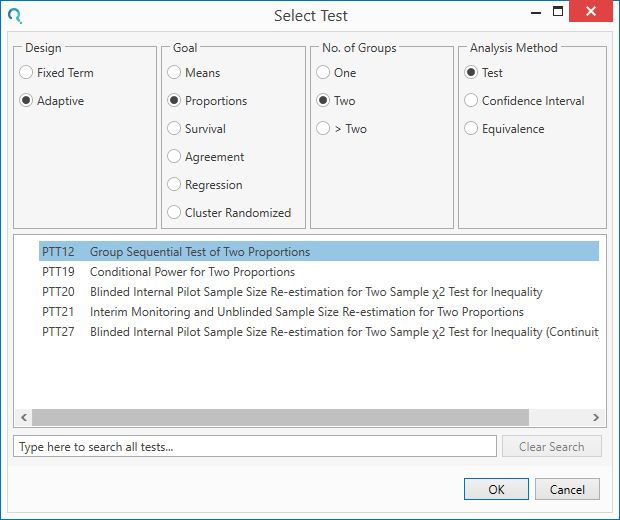
Select the PTT12 Group Sequential Test of Two Proportions table from the Select Test window.
This can be done using the radio buttons below or alternatively, you can use the search bar at the end of the Select Test window.
Step 2:
Enter the significance level and group proportion parameter values taken from the study design.
(Note that the odds ratio will automatically calculate based on the group proportions while the
default values for Continuity Correction and Variance are used.)
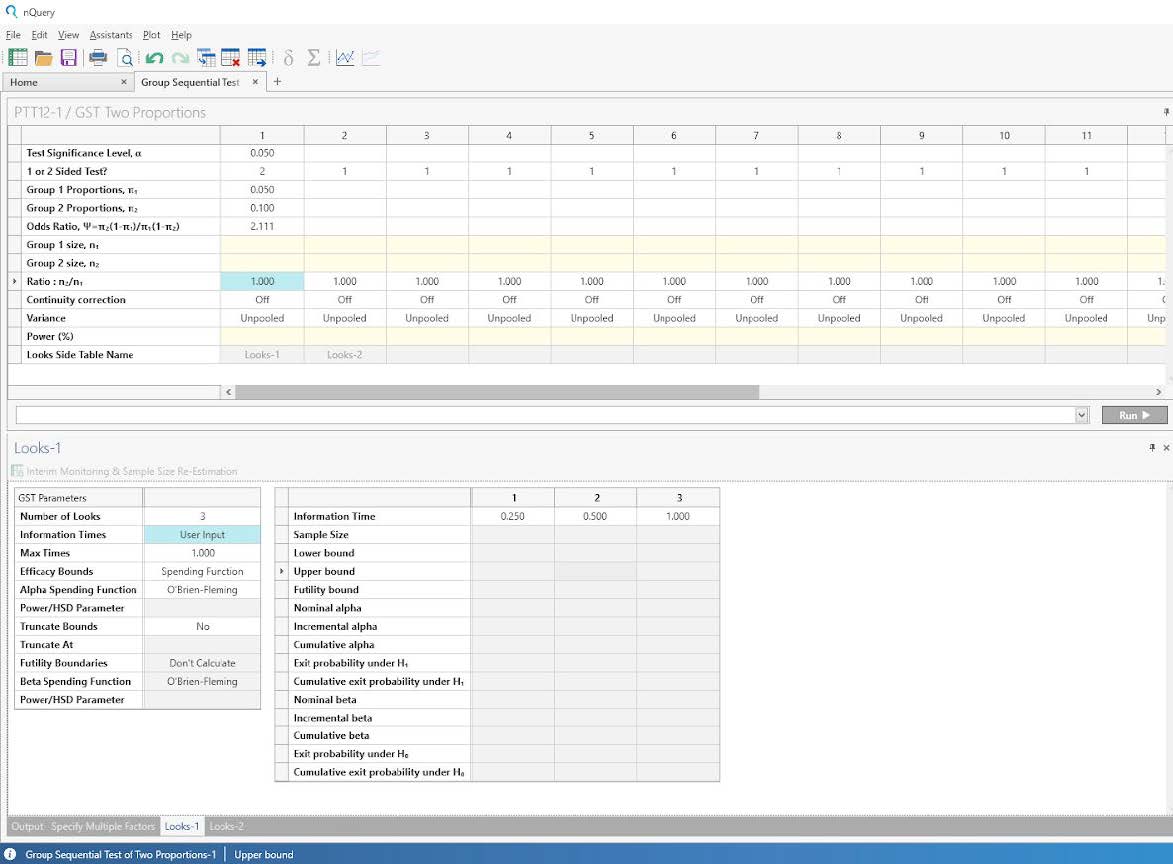
Step 3:
Complete the looks side-table using the values taken from the study design.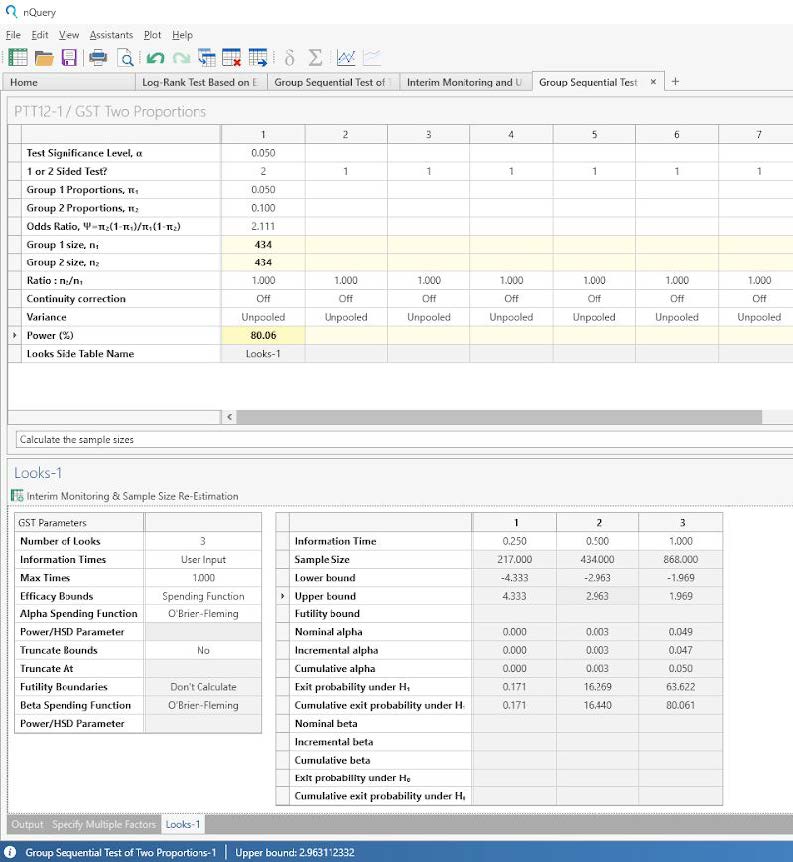
Step 4:
Enter the power for the test and the sample size and looks-side table will be completed.
The analysis results in a sample size per group of 434. This is very similar to the sample size per group of 435 stated in the protocol and the difference is likely due to rounding.
The power of the test is 80.06%.
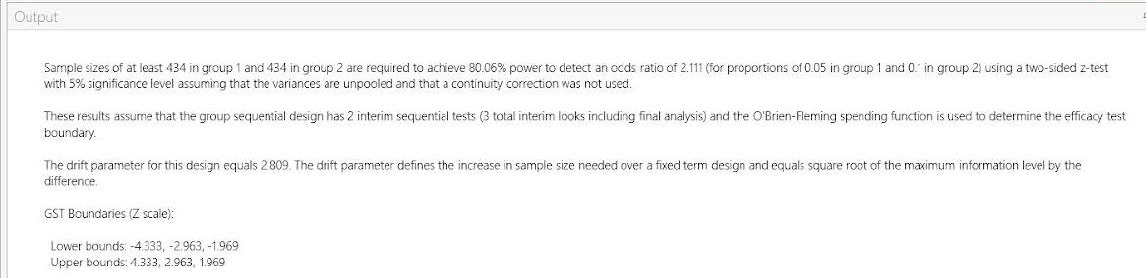
| Output Statement: |
|
“Sample sizes of at least 434 in group 1 and 434 in group 2 are required to achieve 80.06% These results assume that the group sequential design has 2 interim sequential tests (3 total The drift parameter for this design equals 2.809. The drift parameter defines the increase in |
GST Boundaries (Z scale):
Lower bounds: -4.333, -2.963, -1.969
Upper bounds: 4.333, 2.963, 1.969”
This study can be extended to demonstrate an Unblinded Sample Size Re-estimation with Interim Monitoring.
Suppose we wanted to monitor the trial at each look and consider a sample size re-estimation at the second look.
Using the same group sequential design, suppose that the interim placebo
proportion was 0.06 (an increase of 20% from 0.05 ) and that the interim treatment proportion
remained at 0.1.
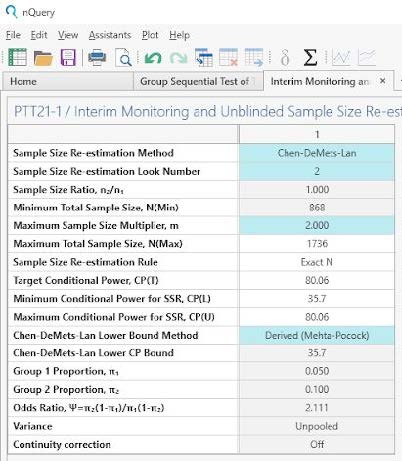
We will use the Chen-DeMets-Lan re-estimation method, the maximum events multiplier will be 2 and we will use the derived Chen-DeMets-Lan lower bound method.
| Additional Parameter Estimates for Unblinded SSR: |
| Parameter | Value |
| Events Re-estimation Method | Chen-DeMets-Lan |
| Events Re-estimation Look Number | 2 |
| Maximum Events Multiplier | 2 |
| Chen-DeMets-Lan Lower Bound Method | Derived (Mehta-Pocock) |
| Interim Placebo Proportion | 0.06 (at all 3 looks) |
| Interim Treatment Proportion | 0.1 |
Step 1:
Click the “Interim Monitoring & Sample Size Re-estimation” button on the PTT12 looks side table to open the PTT21 Interim Monitoring and Unblinded Sample Size Re-estimation for two Proportions table.
Step 2:
Use the Unblinded SSR parameter estimates to complete the first table.
Step 3:
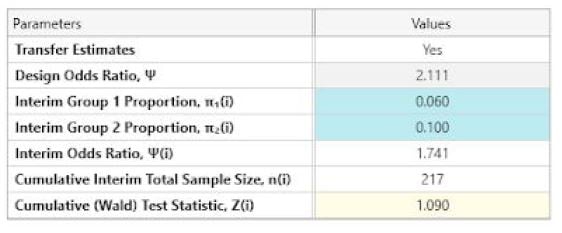
Use the side table to enter the Interim group proportions at all 3 looks.
Note: Ensure that “Transfer Estimates” is set to Yes.
The following is output at each look.
| Look 1 |
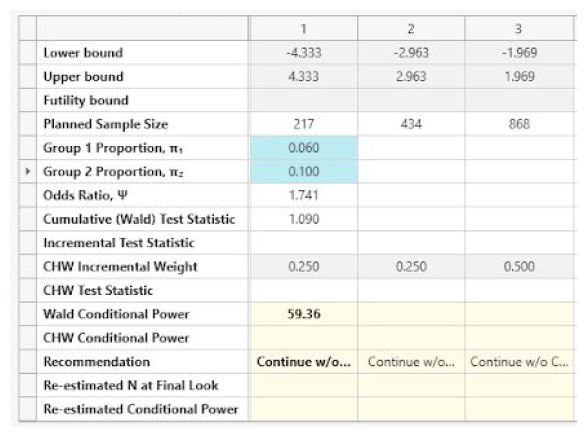
| Look 2 |
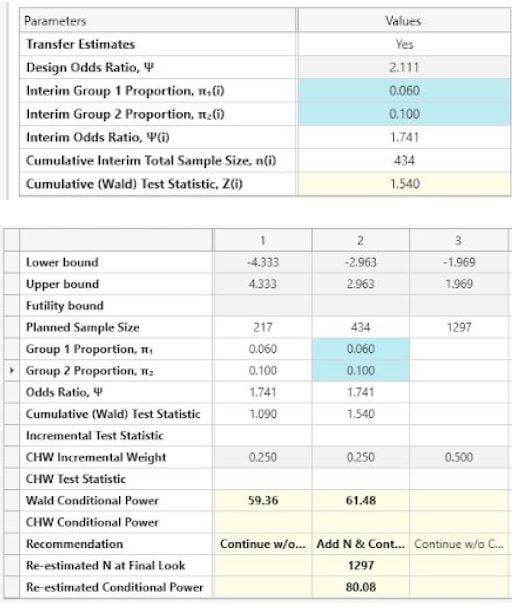
| Look 3 |
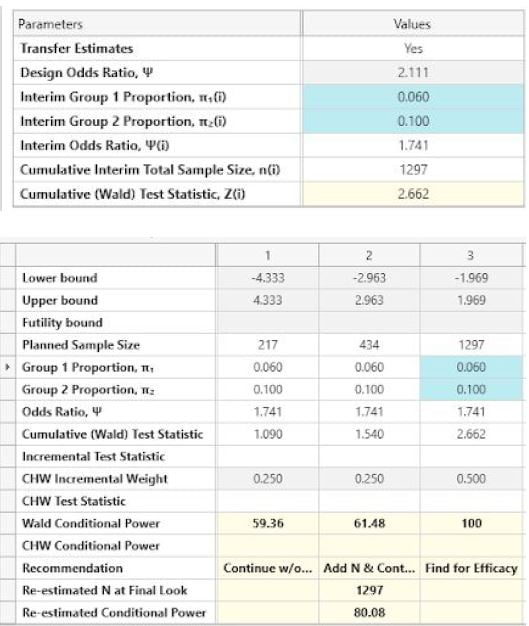
| Result |
|
