Try Now
Pricing
MENU
Try Now
Pricing

What's New in nQuery?

nQuery Sample Size Software In Use Background Image

From fixed to flexible trial designs, the Winter 2019 nQuery release (ver 8.5.0) sees the continued strengthening of nQuery to make it the complete trial design platform to make your clinical trials faster, less costly and more successful.

22 new sample size tables have been added in total

nQuery PRO

New Adapt Tables

nQuery PLUS

New Bayes Tables

nQuery BASE

New Core Tables

7 New Adaptive Tables

(Included in the Pro Package) 

What's New in the nQuery Adapt Module

The Winter 2019 release extends the number of tables on offer for adaptive designs, including for designs used in Phase II clinical trials. 7 new tables have been added.

In this release, the main areas are:

  • MCP-Mod (Multiple Comparisons Modelling)
  • Simon’s Two-Stage Design
  • Group Sequential Tests for Counts/Rates

MCP-Mod

MCP-Mod (Multiple Comparisons Procedure - Modelling) is an increasingly popular statistical methodology for dose-finding Phase IIb trials. Since its development at Novartis, MCP-Mod promises to devise proof-of-concept and dose-ranging trials with greater evidence and data that can prove critical data for Phase III clinical trial design. Combining the robustness of multiple comparisons procedures with the flexibility of modelling, MCP-mod combines these methods to provide superior statistical evidence from Phase II trials with regards to dose selection with the FDA & EMA approving MCP-Mod as fit-for-purpose (FFP).

1 table will be added for MCP-mod

  • MCP-Mod Proof-of-Concept
    • Linear, Linear-Log, Logistic, Emax, Sigmoidal Emax, Exponential, Beta Dose-Response Models
    • Mean, Median, Minimum Power Criteria
    • Optimal or Custom Critical Value

Phase II Design (Simon’s Design)

Phase IIa designs are focussed on proof-of-concept showing the potential efficacy and safety of a proposed treatment. Multi-stage designs are common to allow for flexibility to stop trials early for futility as Phase II is the most common failure point in drug evaluation.

One of the most common multi-stage designs used in Phase IIa clinical trials is Simon's Two-Stage design. The Simon two-stage design is an exact design which allows flexibility regarding the null and alternative hypotheses while also allowing stopping for futility. Simon’s original optimal design, which has the smallest expected sample size, and the minimax design, which has the smallest maximum sample size, are both provided in this release. Single-stage and three-stage variants are also provided in this release.

3 tables will be added for Simon’s Two-Stage Design:

  • Phase II Single Stage Design (A’Hern)

  • Phase II Two Stage Design (Simon's Design)
    • Optimum Design
    • Minimax Design

  • Phase II Three Stage Design
    • Optimum Design
    • Minimax Design

Group Sequential Trials

A Group sequential designs are an adaptive design which allows for early stopping for efficacy or futility at pre-specified interim analyses using the flexible error spending function approach. Group sequential designs are the most common adaptive design used in confirmatory clinical trials as they allow greater flexibility and savings while having operating characteristics similar to a fixed term trial.

Count and incidence rates are a common type of data where the endpoint of interest is the number of events that occur in a given unit of time or repeated counts. Examples in clinical trials include the exacerbation incidence rate in a given year for respiratory diseases such as COPD or the count of the number of lesions found in MRI scans for conditions such as multiple sclerosis. Count models such as Poisson or Negative Binomial allow the full usage of all events found compared to binomial or survival modelling approaches.

Group sequential design for the common Poisson and Negative Binomial models for counts/rates are provided in this release. A group sequential design for a single binomial proportion is also provided in this release.

3 tables will be added for Group Sequential Trials:

  • GST for Poisson Counts
  • GST for Negative Binomial Count
  • GST for One Proportion (Null Variance)

List of New Tables in nQuery's Adaptive Module

MCP-Mod 

  • MCP-Mod Proof-of-Concept
    • Linear, Linear-Log, Logistic, Emax, Sigmoidal Emax, Exponential, Beta Dose-Response Models
    • Mean, Median, Minimum Power Criteria
    • Optimal or Custom Critical Value
Simon’s Two-Stage Design
  • Phase II Single Stage Design (A’Hern)
  • Phase II Two Stage Design (Simon's Design)
    • Optimum Design
    • Minimax Design
  • Phase II Three Stage Design
    • Optimum Design
    • Minimax Design
Group Sequential Trials
  • GST for One Proportion (Null Variance)
  • GST for Poisson Counts
  • GST for Negative Binomial Counts

VIEW ALL SAMPLE SIZE PROCEDURES AVAILABLE

How To Update

To access the adaptive module you must have a nQuery Advanced Pro subscription. If you do, then nQuery should automatically prompt you to update.

You can manually update nQuery Advanced by clicking Help>Check for updates.

CLICK HERE FOR FULL DETAILS ABOUT UPDATING

nQuery Advanced Check for Updates


Ask A Question

2 New Bayesian Tables

(Included in the Plus & Pro Package) 

What's New in the nQuery Bayes Module

The Winter 2019 release extends the tables for sample size calculation using Bayesian credible intervals. This release extends the sample size framework to the single proportion interval case.

Binomial Proportion

A binomial proportion interval is an interval for the most probable values for a given binomial proportion e.g. number of yes/no’s. A credible interval is a Bayesian interval which contains a given proportion of posterior density for the given parameter, here the binomial proportion, within it.
The method in nQuery assumes a highest posterior density (HPD) interval with a beta prior for the proportion with three criteria for sample size provided: average length criterion (ALC), average coverage criterion (ACC), worst outcome criterion (WOC).

Tables are provided for the HPD credible interval, where the final interval of interest will only be the credible interval, and mixed Bayesian/Likelihood interval, where the final interval needs to fulfill both the credible and likelihood (i.e. frequentist confidence interval) error definitions.

The 2 new tables are:

  • Binomial Proportion using Credible Intervals Bayes
  • Binomial Proportion using MBL Credible Intervals

List of New Bayes Tables

Binomial Proportion

  • Binomial Proportion using Credible Intervals Bayes
  • Binomial Proportion using MBL Credible Intervals

VIEW ALL SAMPLE SIZE PROCEDURES AVAILABLE


How To Update

To access these tables, you must have a nQuery Advanced Plus or Advanced Pro subscription.

If you do, nQuery should automatically prompt you to update.

You can manually update nQuery Advanced by clicking Help>Check for updates.

CLICK HERE FOR FULL DETAILS ABOUT UPDATING

nQuery Advanced Check for Updates

If your nQuery home screen is different, you are using an older version of nQuery.
Please contact your Account Manager.

Ask A Question

13 New Base Tables

(Included in all packages: Base, Plus & Pro Package) 

What's New in the nQuery Base Module

The Winter 2019 release extends the number of tables on offer for classical trial designs. 13 new tables have been added.

In this release, the main areas are:

  • Count/Incidence Rate Models
  • Post-Marketing Surveillance
  • Non-Inferiority Log Rank

Count/Incidence Rate Models

Count and incidence rates are a common type of data where the endpoint of interest is the number of events that occur in a given unit of time or repeated counts. Examples in clinical trials include the exacerbation incidence rate in a given year for respiratory diseases such as COPD or the count of the number of lesions found in MRI scans for conditions such as multiple sclerosis. Count models such as Poisson or Negative Binomial allow the full usage of all events found compared to binomial or survival modelling approaches.

4 tables will be added:

  • Poisson Cross-over Designs (2x2, Stepped Wedge CRT)
  • Andersen-Gill Model
  • Negative Binomial Model

Poisson Cross-over Designs (2x2, Stepped Wedge CRT)

The Poisson distribution is popular for modelling the number of times an event occurs in an interval of time or space. The Poisson distribution is characterized by a single parameter which is the mean number of occurrences during the specified interval.

In a crossover design each subject receives all treatments at least once with the objective of measuring study differences among the treatments. “Crossover” comes from the most common two treatments case which is of interest here. Crossover designs are popular due to an expected increase in precision, since each subject effectively acts as their own control, and the concomitant reduction in study size but do have additional statistical and practical complications such as carry-over effects.

The stepped-wedge cluster randomized design is a cross-over design in which each cluster, rather than subject, receives both the treatment and control. Cluster randomized trials (CRT) are trials where the assigned treatment is applied to all subjects selected in a cluster rather than random assignment within each cluster. For a complete stepped-wedge design, all clusters are initially assigned to the control group and a fixed number of clusters switch to the treatment group for the rest of the study with different subjects measured within each cluster and no subject is measured more than once. Stepped-wedge designs are useful in cases where it is difficult to apply a particular treatment to half of the clusters at the same time.

Cross-over designs for count/rates data is provided for the Poisson model in this release for the inequality, non-inferiority and equivalence cases. The stepped-wedge CRT for Poisson count/rate data is provided in this release for the inequality case.

4 tables will be added:

  • Two Poisson Cross-over Non-inferiority
  • Two Poisson Cross-over Equivalence
  • Two Poisson Cross-over Inequality
  • Stepped Wedge CRT Poisson Inequality

Anderson Gill Model

The Andersen-Gill (AG) generalizes the Cox model from the single event (survival) to multiple event (counts/rates) context, with the rate characterized in terms of the increments of time between events. As per the semi-parametric Cox model, it assumes a common unknown baseline hazard function for events. This allows the AG model greater flexibility versus the Poisson and Negative Binomial models, which assume a constant event rate, while providing comparable results when the event rate is constant.

Sample size for comparing the rates/counts in two independent groups using the Andersen-Gill model assuming a Weibull hazard rate is provided in this release for the inequality, non-inferiority and equivalence cases.

3 tables will be added:

  • Non-inferiority Test for Ratio of Two Incidence Rates using Anderson-Gill Model
  • Equivalence Test for Ratio of Two Incidence Rates using Anderson-Gill Model
  • Inequality Test for Ratio of Two Incidence Rates using Anderson-Gill Model

Inequality for Negative Binomial Unequal Follow-Up

The Negative Binomial model is a generalization of Poisson regression which loosens the restrictive assumption that the variance is equal to the mean. Loosening this restriction allows the flexibility to deal with the common occurrence of overdispersed count data which would cause lower power and accuracy for the Poisson model. Most negative binomial regression models (e.g. NB2) are based on the Poisson-gamma mixture distribution.

Sample size for comparing the rates/counts in two independent groups using the Negative Binomial is provided in this release for the inequality cases allowing for unequal follow-up times, dropout and dispersion parameters.

1 table will be added:

  • Inequality Test for Ratio of Two Incidence Rates using Negative Binomial Model

Post Marketing Surveillance

Postmarketing surveillance (PMS) is the practice of monitoring the safety of a pharmaceutical drug or medical device after it has been released on the market and is an important part of the science of pharmacovigilance. Postmarketing surveillance can further refine, or confirm or deny the safety of a drug or device, after it is used in the general population who will have a wider variety of medical conditions than seen in a confirmatory clinical trial.

Four potential PMS designs are provided in this release with three cohort designs, with different assumptions about the adverse reaction rate, and the case-control design.

4 tables will be added:

  • Post-Marketing Surveillance with No Adverse Reaction Rate
  • Post-Marketing Surveillance with Known Adverse Reaction Rate
  • Post-Marketing Surveillance with Unknown Adverse Reaction Rate
  • Post-Marketing Surveillance for Matched Case-Control Study

Non-Inferiority Log rank Test

The log-rank test is one of the most common statistical tests used for the analysis of survival data. It’s flexibility and interpretability provide useful insights into the comparable hazard rates in survival clinical trials.

Non-inferiority tests are used to statistically evaluate if a proposed treatment is not worse than a pre-existing standard treatment by testing if the result is statistically better than a specified non-inferiority margin. This is a very common objective in areas such as generics and medical devices.

Sample size for the non-inferiority log-rank test comparing two independent survival curves is provided here with flexibility to allow the alternative hypothesis hazard ratio to differ from 1 (i.e. equal survival rates per group).

1 table will be added:

  • Non-inferiority Log-Rank Test (non-1 HR default)

New Home Screen & User Interface Updates

The Winter 2019 update sees numerous small but great user interface improvements to nQuery. The first one you will notice is the great new home screen. Here you will have quick access to a host of common tasks in addition to easily seeing what nQuery Packages you have.nQuery-Advanced-8.5-Home-page-update

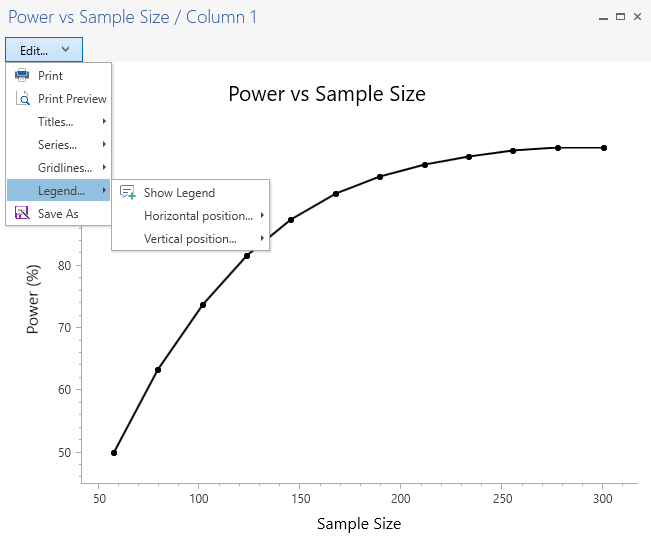
Updated Graphing Tool

The graphing tool in nQuery has also been updated for greater flexibility for the user. The default color scheme is now black and white with many options to customize graphs. The new powerful graphing tool makes graphs exported from nQuery perfect for regulatory and academic submissions.

nQuery-Advanced-ver8.5-Graph-Upgrades

List of New Core Tables

Two-Poisson Test

  • CRT Two Poisson Rates Stepped-Wedge Design
  • Two Poisson Cross-over Non-inferiority
  • Two Poisson Cross-over Equivalence
  • Two Poisson Cross-over Inequality

Anderson Gill Model

  • Non-inferiority Test for Ratio of Two Incidence Rates using Anderson-Gill Model
  • Equivalence Test for Ratio of Two Incidence Rates using Anderson-Gill Model
  • Inequality Test for Ratio of Two Incidence Rates using Anderson-Gill Model

Post Marketing Surveillance

  • Post-Marketing Surveillance with No Adverse Reaction Rate
  • Post-Marketing Surveillance with Known Adverse Reaction Rate
  • Post-Marketing Surveillance with Unknown Adverse Reaction Rate
  • Post-Marketing Surveillance for Matched Case-Control Study

Non-Inferiority Log rank Test

  • Non-inferiority Log-Rank Test (non-1 HR default)

Inequality for Negative Binomial Unequal Follow-Up

  • Inequality Test for Ratio of Two Incidence Rates using Anderson-Gill Model

VIEW ALL SAMPLE SIZE PROCEDURES AVAILABLE


How To Update

If you have nQuery Advanced installed, nQuery should automatically prompt you to update.

You can manually update nQuery Advanced by clicking Help>Check for updates.

CLICK HERE FOR FULL DETAILS ABOUT UPDATING

nQuery Advanced Check for Updates

If your nQuery home screen is different, you are using an older version of nQuery.
Please contact your Account Manager.

Ask A Question

Start your 14-day free trial

Try Now For Free