Try Now
Pricing
MENU
Try Now
Pricing
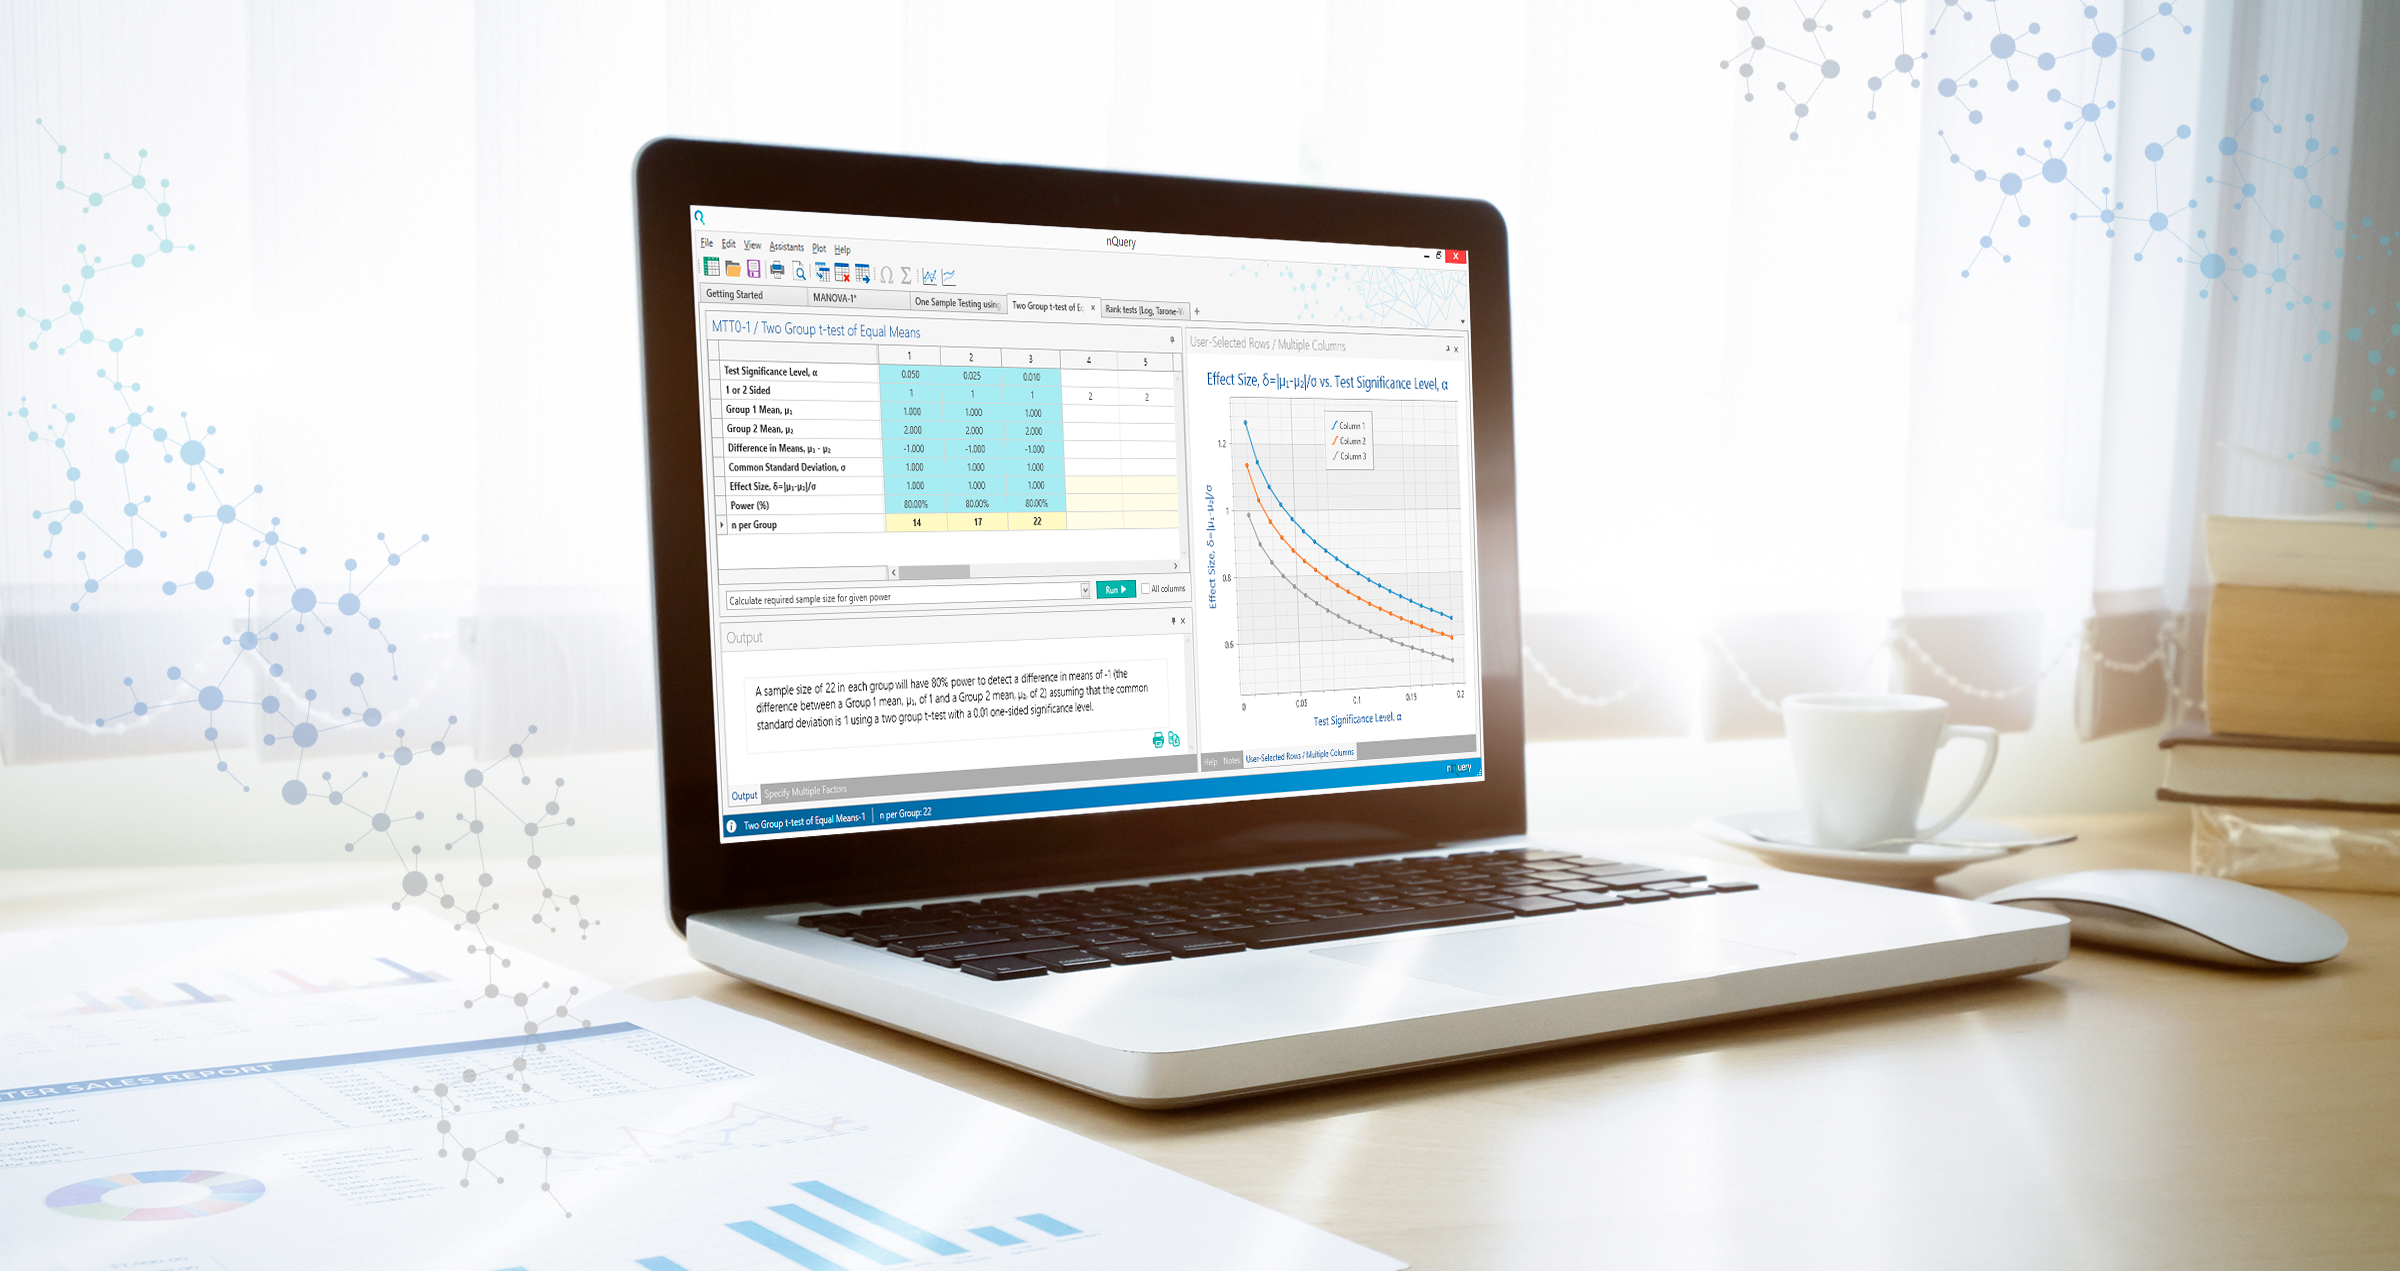
nQuery Sample Size Software In Use Background Image

What's New in nQuery

Winter 2018 Release

15 New Adapt Tables

12 New Bayes Tables

20 New Base Tables

The Winter 2018 update to nQuery sees the introduction of a brand new module. This extends nQuery’s capabilities in the planning and analysis of adaptive trials. In addition to this, a further 32 new tables have been added to the core and Bayes modules.

With increasing costs and failure rates in drug development an increasingly important issue, adaptive trials offer one mechanism to alleviate these problems and make clinical trials better reflect the statistical and practical needs of trial sponsors. These issues have also spurred an increasing openness towards innovative clinical trial designs in regulatory agencies around the world.

15 New Adaptive Tables
(Included in the Pro Package) 

What's New

For a quick summary of the new Adaptive module, play the video below or click on the tabs above.

Winter 2018 nQuery Release Notes - nQuery Adapt - Adaptive Trial Module
In the initial nQuery Adapt release, we will be adding 15 new tables. This summary will provide an overview of which areas have been targeted in this release along with the full list of the tables being added.

In this release, four main areas are targeted for development. These are:

  • Group Sequential Designs
  • Conditional Power and Predictive Power
  • Unblinded Sample Size Re-estimation
  • Blinded Sample Size Re-estimation

Continue to explore the new Adaptive Module by clicking on the tabs above  green arrow for tab 1


Group Sequential Designs

Group sequential designs are the most widely used type of adaptive trial in confirmatory Phase III clinical trials. Group sequential designs differ from a standard fixed term trial by allowing a trial to end early at pre-specified interim analyses for efficacy or futility. Group sequential designs achieve this by using an error spending method which allows a set amount of the total Type I (efficacy) or Type II (futility) error at each interim analysis. This design thus allows the trialist the flexibility to end those trials early which would otherwise have needed another large cohort of subjects to be analysed unnecessarily.

In the initial nQuery Adapt release, three new group sequential design tables will be added. These will be in addition to the three group sequential design tables which will continue to be included in the core product for two-sample group sequential designs. The new exclusive nQuery Adapt release group sequential design tables will be as follows:

  • Group Sequential Design for One Mean
  • Group Sequential Design for One Proportion
  • Group Sequential Design for Two Survival Curves accounting for Accrual Period

These tables extend nQuery’s capabilities into one sample designs and also allow survival models with greater flexibility regarding follow-up time and accrual. Future nQuery Adapt updates will continue to increase the number of group sequential designs available.

In addition, this nQuery Advanced Update will include a number of improvements to the core group sequential design methods. The two major changes will be the addition of futility only designs and additional detail on the group sequential design, including the required sample size at each look. All group sequential tables will continue to be improved in future updates.

Continue to explore the new Adaptive Module by clicking on the tabs above  green arrow for tab 1

Conditional Power and Predictive Power

In group sequential designs and other adaptive designs, access to the interim data gives the ability to answer the important question of how likely a trial is to succeed based on the information accrued so far. The two most commonly cited statistics to evaluate this are conditional power and predictive power.

Conditional power is the probability that the trial will reject the null hypothesis at a subsequent look given the current test statistic and the assumed parameter values, which are usually assumed to equal their interim estimates. Predictive power (also known as Bayesian Predictive Power) is the conditional power averaged over the posterior distribution of the effect size. Both of these give an indication of how promising a study is based on the interim data and are important both as ad-hoc measures of futility testing and defining the range of values useful for unblinded sample size re-estimation.

In the initial nQuery Adapt release, five tables will be added for conditional power and predictive power covering many of the most common study design scenarios. These tables allow nQuery Adapt users to analyse and investigate different scenarios and assumptions for how likely a trial is to succeed based on the interim data. The new exclusive nQuery Adapt release conditional power tables will be as follows:

  • Conditional and Predictive Power for One Mean
  • Conditional and Predictive Power for Two Means
  • Conditional and Predictive Power for One Proportion
  • Conditional and Predictive Power for Two Proportions
  • Conditional and Predictive Power for Two Survival Curves

These tables will allow conditional and predictive power to be calculated simultaneously by assuming a diffuse prior for the predictive power calculation. Future updates will extend the number of design scenarios covered and additional flexibility in priors for predictive power.

Continue to explore the new Adaptive Module by clicking on the tabs above  green arrow for tab 1

Unblinded Sample Size Re-estimation

In group sequential designs and other similar designs, access to the interim data provides the opportunity to improve a study to better reflect the updated understanding of the study. One way a group sequential design would be to use the interim effect size estimate not only to decide to whether or not to stop a trial early but to increase the sample size if the interim effect size is promising. This optionality gives the trialist the chance to power for a more optimistic effect size, thus reducing up-front costs, while still being confident of being able to find for a smaller but clinically relevant effect size by increasing sample size if needed.

The most common way to define whether an interim effect size is promising is conditional power. Conditional power is the probability that the trial will reject the null hypothesis at a subsequent look given the current test statistic and the assumed parameter values, which are usually assumed to equal their interim estimates. For “promising” trials where the conditional power falls between a lower bound, a typical value would be 50%, and so the initial target power of the sample size can be increased to make the conditional power equal the target study power.

In the initial nQuery Adapt release, two tables will be added for unblinded sample size re-estimation. These tables allow nQuery Adapt users to extend their initial group sequential design by giving tools which allow users to conduct interim monitoring and conduct a flexible sample size re-estimate at a specified interim look. The new exclusive nQuery Adapt release unblinded sample size re-estimation tables will be as follows:

  • Unblinded Sample Size Re-estimation & Interim Monitoring for Two Means
  • Unblinded Sample Size Re-estimation & Interim Monitoring for Two Proportions

Both these tables will be accessible by designing a group sequential study using the relevant group sequential designs and using the “Interim Monitoring & Sample Size Re-estimation” option from the group sequential “Looks” table. These tables will provide for two common approaches to unblinded sample size re-estimation: Chen-DeMets-Lan and Cui-Hung-Wang. There is also an option to ignore the sample size re-estimation and conduct interim monitoring for standard group sequential design.

The Chen-DeMets-Lan method allows a sample size increase while using the standard group sequential unweighted Wald statistics without appreciable error inflation, assuming an interim result has sufficiently "promising" conditional power. The primary advantages of the Chen-DeMets-Lan method are being able to use the standard group sequential test statistics and that each subject will be weighted equally to the equivalent group sequential design after a sample size increase. However, this design is restricted to the final interim analysis and Type I error control is expected but not guaranteed depending on the sample size re-estimation rules.

The Cui-Hung-Wang method uses a weighted test statistic, using pre-set weights based on the initial sample size and the incremental interim test statistics, which strictly controls the type I error. However, this statistic will differ from that of a standard group sequential design after a sample size increase and since subjects are weighted on the initial sample size, those subjects in the post-sample size increase cohort will be weighted less than those before.

There will be full control over the rules for the sample size re-estimation including sample size re-estimation look (for Cui-Hung-Wang), maximum sample size, whether to increase to the maximum sample size or the sample size to achieve the target conditional power and bounds for what a “promising” condition power is, among others.

Future nQuery Adapt updates will increase the number of study designs available, including for survival studies, and the number of options and flexibility for planning an unblinded sample size re-estimation.

Continue to explore the new Adaptive Module by clicking on the tabs above   green arrow for tab 1

Blinded Sample Size Re-estimation

Sample size determination always requires a level of uncertainty over the assumptions made to find the appropriate sample size. Many of these assumed values are for nuisance parameters which are not directly related to the effect size. Thus it would useful to have a better estimate for these values than relying on external sources or the cost of a separate pilot study but without the additional regulatory and logistical costs of using unblinded interim data. Blinded sample size re-estimation allows the estimation of improved estimates for these nuisance parameters without unblinding the study.

In the initial nQuery Adapt release, five tables will be added for blinded sample size re-estimation using the internal pilot method. The internal pilot method assigns an initial cohort of subjects as the “pilot study” and then calculates an updated value for a nuisance parameter of interest. This updated nuisance parameter value is then used to increase the study sample size if required, with the final analysis conducted with standard fixed term analyses with the internal pilot data included.

These tables allow nQuery Adapt users to seamlessly conduct an internal pilot study for common two means and two proportions design scenarios. The new exclusive nQuery Adapt release blinded sample size re-estimation tables will be as follows:

  • Blinded Sample Size Re-estimation for Two Sample t-test for Inequality Difference
  • Blinded Sample Size Re-estimation for Two Sample t-test for Non-inferiority Difference
  • Blinded Sample Size Re-estimation for Two Sample t-test for Equivalence Difference
  • Blinded Sample Size Re-estimation for Two Sample Chi-Squared Test for Inequality 
  • Blinded Sample Size Re-estimation for Two Sample Chi-Squared Test for Non-inferiority

nQuery Adapt will provide full flexibility over the size of the internal pilot study, whether sample size decreases are allowable in addition to increase and tools to derive the best-blinded estimate from the internal pilot.

Blinded sample size re-estimation for the two sample t-test updates the sample size based on a blinded estimate of the common within-group standard deviation. Three methods are available to estimate the within-group standard deviation from the internal pilot data: pilot standard deviation, bias-adjusted pilot standard deviation, upper confidence limit for pilot standard deviation.

Blinded sample size re-estimation for the two sample chi-squared test updates the sample size based on a blinded estimate of the total proportion of successes and combining this with the initial proportion difference estimate. The user can enter either the proportion of successes or number of successes for the equivalent analysis.

Future updates will extend the number of design scenarios covered, with additional options to derive the blinded nuisance parameter estimate alternative approaches for blinded sample size re-estimation such as p-value combination.

Continue to explore the new Adaptive Module by clicking on the tabs above   green arrow for tab 1

List of New Adapt 2018 Tables

Group Sequential Designs

  • Group Sequential Design for One Mean
  • Group Sequential Design for One Proportion
  • Group Sequential Design for Two Survival Curves accounting for Accrual Period

Conditional Power and Predictive Power

  • Conditional and Predictive Power for One Mean
  • Conditional and Predictive Power for Two Means
  • Conditional and Predictive Power for One Proportion
  • Conditional and Predictive Power for Two Proportions
  • Conditional and Predictive Power for Two Survival Curves

Unblinded Sample Size Re-estimation

  • Unblinded Sample Size Re-estimation & Interim Monitoring for Two Means
  • Unblinded Sample Size Re-estimation & Interim Monitoring for Two Proportions

Blinded Sample Size Re-estimation

  • Conditional and Predictive Power for One Mean
  • Conditional and Predictive Power for Two Means
  • Conditional and Predictive Power for One Proportion
  • Conditional and Predictive Power for Two Proportions
  • Conditional and Predictive Power for Two Survival Curves

VIEW ALL SAMPLE SIZE PROCEDURES AVAILABLE IN nQuery

Continue to explore the new Adaptive Module by clicking on the tabs above  green arrow for tab 1

How to Update

nQuery Adapt is a new module in nQuery. This is only available if you have a subscription for nQuery Advanced Pro

To access nQuery Adapt, please contact your Account Manager or complete the contact form.

Ask A Question

12 New Bayesian Tables

(Included in the Plus & Pro Package) 

What's New

Winter 2018 Bayesian Module Release Notes
The latest release extends the number of tables on offer in the Bayesian module.

There are 12 new tables available, all for calculating assurance in different designs and setups. 

Assurance is the unconditional probability that the trial will yield a positive result (usually a significant p-value) and is the expectation for the power averaged over the prior distribution of the unknown parameter estimate. This provides a useful estimate of the likely utility of a trial and provides an alternative method to frequentist power for finding the appropriate sample size for a study. For this reason, assurance is often referred to as “Bayesian power” or the "true probability of success".

Continue to explore the new Bayes tables by clicking on the tabs above  green arrow for tab 1

Non-Inferiority

This new release covers non-inferiority tests for assurance for a number of trial designs.

Non-inferiority tests are used to statistically evaluate if a proposed treatment is not worse than a pre-existing standard treatment. This is a very common objective in areas such as generics and medical devices. This is particularly important as using a placebo group would be required otherwise.

As non-inferiority testing will typically involve evaluation against a well-defined treatment (e.g. RLD), there is a lower incidence of the large parallel studies typically seen in Phase III clinical trials. One-sample, paired samples or cross-over designs are common as these will generally require a lower cost and sample size.

There are four tables covering non-inferiority testing using assurance in the new release of nQuery:

  • Non-Inferiority Bayesian Assurance for Two Proportions with Beta Prior for π₁
  • Non-Inferiority Bayesian Assurance for Two Proportions with Uniform Prior for π₁
  • Non-Inferiority Bayesian Assurance for Two Survival Curves with Normal Prior for Log(HR)
  • Non-Inferiority Bayesian Assurance for Two Survival Curves with Uniform Prior for Log(HR)

These tables give more flexibility to the nQuery user for the type of test that can be performed using Bayesian assurance.

Continue to explore the new Bayes tables by clicking on the tabs above  green arrow for tab 1

Uniform Priors

This release further focuses on extending the range of prior distributions that are available to calculate assurance.

Uniform priors have now been added to five more trial designs. These priors give equal likelihood to each point in the defined range of the distribution. This non-informative prior is of relevance if there is no prior information relating to the distribution of the parameter of interest, and so a prior with minimal influence on the inference is required.

The designs with the option of uniform prior distributions are:

  • Bayesian Assurance for One Proportion with Uniform Prior
  • Bayesian Assurance for Two Proportions with Uniform Prior for π₁
  • Bayesian Assurance for Two Survival Curves with Uniform Prior for Log(HR)
  • Non-Inferiority Bayesian Assurance for Two Proportions with Uniform Prior for π₁
  • Non-Inferiority Bayesian Assurance for Two Survival Curves with Uniform Prior for Log(HR)

These tables help you quickly and simply calculate the assurance attainable by your trial, when the range of possible values of your parameter, is all that is known in advance.

Continue to explore the new Bayes tables by clicking on the tabs above  green arrow for tab 1

Custom Priors

The latest release of nQuery also gives you the option of using a custom prior for calculating assurance.

There are five tables that allow a custom prior.

  • Bayesian Assurance for One Mean with Custom Prior
  • Bayesian Assurance for Mean Difference with Custom Prior
  • Bayesian Assurance for One Proportion with Custom Prior
  • Bayesian Assurance for Two Proportions with Custom Prior for π₁
  • Bayesian Assurance for Two Survival Curves with Custom Prior for Log(HR)

A custom prior can be used if the distribution of your alternative hypothesis parameter does not conform to a common distribution. These tables allow you to define the points of your prior distribution and the probabilities connected to each value. In this way, the prior takes the form of a discrete probability distribution.

These tables allow versatility and freedom in your trial design, especially if your data does not conform to a more commonly used distribution.

Continue to explore the new Bayes Tables by clicking on the tabs above  green arrow for tab 1

List of New Bayes Tables

Bayesian Assurance

  • PTE3 Non-Inferiority Bayesian Assurance for Two Proportions with Beta Prior for π₁
  • PTE4 Non-Inferiority Bayesian Assurance for Two Proportions with Uniform Prior for π₁
  • STE5 Non-Inferiority Bayesian Assurance for Two Survival Curves with Normal Prior for Log(HR)
  • STE6 Non-Inferiority Bayesian Assurance for Two Survival Curves with Uniform Prior for Log(HR)
  • POT6 Bayesian Assurance for One Proportion with Uniform Prior
  • PTT11 Bayesian Assurance for Two Proportions with Uniform Prior for π₁
  • STT11 Bayesian Assurance for Two Survival Curves with Uniform Prior for Log(HR)
  • MOT25 Bayesian Assurance for One Mean with Custom Prior
  • MTT21 Bayesian Assurance for Mean Difference with Custom Prior
  • POT7 Bayesian Assurance for One Proportion with Custom Prior
  • PTT13 Bayesian Assurance for Two Proportions with Custom Prior for π₁
  • STT14 Bayesian Assurance for Two Survival Curves with Custom Prior for Log(HR)

VIEW ALL SAMPLE SIZE PROCEDURES AVAILABLE IN nQuery

 Continue to explore the new Bayes tables by clicking on the tabs above  green arrow for tab 1

How to Update

To access nQuery Bayes, you must have a nQuery Advanced Plus or Advanced Pro subscription. If you do, nQuery should automatically prompt you to update.

You can manually update nQuery Advanced by clicking Help>Check for updates.

CLICK HERE FOR FULL DETAILS ABOUT UPDATING

nQuery Advanced Check for Updates

If your nQuery home screen is different, you are using an older version of nQuery.
Please contact your Account Manager.

Ask A Question

20 New Classical Sample Size Tables

(Included in all packages: Base, Plus & Pro) 

What's New

Winter 2018 Classical Sample Size Release Notes
In the latest release, we are adding 20 new sample size tables to the nQuery Base module. This release summary will provide an overview of which areas have been targeted in this release along with the full list of tables being added.

In this release, two main areas are targeted for development. These are:

  • Crossover Trials
  • Binary Outcome Trials (Proportion data)

A background to these areas along with a list of the sample size tables which are added in this release is provided in each section. References for each method are provided at the end of this article.

Continue to explore the new Core tables by clicking on the tabs above  green arrow for tab 1

Crossover Trials

Crossover trials use a repeated measures design, where each subject receives more than one treatment, with different treatments given in different time periods. This is where the term “crossover” comes from - the patients cross over from one treatment to another during the course of the trial. The main benefit of a crossover trial is the removal of the between subject effect that impacts a typical parallel trial design - where patients are randomized to a treatment and stay on that treatment for the full trial period.

There are many other reasons to consider using a crossover trial design. It can yield a more efficient use of resources as fewer subjects may be required in the crossover design than a parallel design to achieve the same power.

Crossover trials are usually used to study short-term outcome in chronic conditions or diseases, as the treatment can not permanently alter the condition. The condition must persist long enough for the subject to be exposed to each of the treatments, and the response to each measured. Conditions which are often suitable for crossover trials include asthma, as the disease can often remain relatively stable for a number of years, in addition to rheumatism and migraine.

There are many different variations of crossover trial designs, depending on the type of data available and the assumptions involved. Most traditional crossover designs involve two treatments (A and B), and each subject receives each treatment, either A then B, or B then A. Many other variations of this traditional crossover design are now employed in clinical trials. In the October release, 11 new crossover tables will be added, building on the suite of crossover tables already available in nQuery Advanced.

The main areas of focus in the crossover upgrade fall under the following headings:

  1. Williams Crossover Designs
  2. Generalized Odds Ratio for 2x2 Design

Williams Crossover Designs

Williams crossover designs are outlined by Chow and Liu (2009). Williams designs use an a x k crossover design setup, where there are k treatments and orderings of these treatments. If k is even, the number of sequences in the trial will equal k, giving a k x k crossover design. If k is odd, the number of sequences is 2k, giving a 2k x k crossover design. These designs are particularly popular in the area of bioequivalence and are an ideal choice when there are more than two treatments in a trial.

In the latest nQuery release, we are adding 8 new tables in this area. They are as follows:

  1. Test for Pairwise Mean Differences in a Williams Crossover Design
  2. Non-Inferiority Test for Pairwise Mean Differences in a Williams Crossover Design
  3. Equivalence Test for Pairwise Mean Differences in a Williams Crossover Design
  4. Superiority by a Margin Test for Pairwise Mean Differences in a Williams Crossover Design
  5. Test for Pairwise Proportion Differences in a Williams Crossover Design
  6. Non-Inferiority Test for Pairwise Proportion Differences in a Williams Crossover Design
  7. Equivalence Test for Pairwise Proportion Differences in a Williams Crossover Design
  8. Superiority by a Margin Test for Pairwise Proportion Differences in a Williams Crossover Design

These tables in nQuery give more flexibility for higher-order crossover designs, while remaining straightforward to use.

Generalized Odds Ratio for 2x2 Design

Generalized odds ratios are another way of specifying the effect size in a clinical trial or study, where the data is ordinal in nature. Methods using generalized odds ratios for ordinal data in crossover trials were developed as methods for continuous interval data are not explicitly appropriate for use in these cases. The generalized odds ratio is defined in terms of the relative effect of the treatment to the control, and so can be easily appreciated and interpreted.  

The new nQuery release contains 3 tables in this area:

  1. Test for Generalised Odds Ratio 2x2 Crossover
  2. Equivalence Test for Generalised Odds Ratio 2x2 Crossover
  3. Non-Inferiority Test Generalised Odds Ratio 2x2 Crossover

These tables complement the existing 2x2 crossover tables in nQuery, giving greater flexibility for different types of data when exploring sample size estimates for crossover studies.

Continue to explore the new Core tables by clicking on the tabs above  green arrow for tab 1

Binary Outcome Trials (Proportion data)

Binary data is one of the most common data forms used as an endpoint for clinical trials. Binary data can result from almost any sort of trial where “success” and “failure” can be explicitly defined.

Common design types in this context would be one-sample, paired and parallel studies. In the context of binary data, one of the most noticeable aspects is the wide variety of options available ranging from relatively simple normal approximation tests to more complex exact methods and sample size methods have followed this trend in regard to binary data analyses generally.

This release will bring 9 new tables that deal with different trial designs with binary endpoints, extending the range of designs for proportions data already on offer.

These tables fall into three broad categories:

  1. Wald Tests for Logistic Regression
  2. Equivalence Tests for Correlated Proportions

Wald Tests for Logistic Regression

These tables give further methods to characterise the effect of a binary variable on an outcome. Logistic regression is used to explain the relationship between a binary response variable and one or more explanatory or exposure variables. Logistic regression is used in particular, rather than linear regression, when the response variable is categorical in nature. For example, an exposure variable may be whether a subject smoked or not, while the response variable may be the presence or absence of cancer in the subject.

The Wald test is then used to test the significance of an exposure variable, or an interaction between an exposure variable and some other confounding variable. Calculations are made according to the method outlined by Demidenko (2007).

In the latest nQuery release we are adding 6 new tables in this area:

  1. Wald Test for the Odds Ratio in Logistic Regression with One Binary Covariate
  2. Wald Test for the Odds Ratio in Logistic Regression with Two Binary Covariates
  3. Wald Test for the Interaction Odds Ratio in Logistic Regression with Two Binary Covariates
  4. Confidence Interval for the Odds Ratio in Logistic Regression with One Binary Covariate
  5. Wald Test for the Odds Ratio in Logistic Regression with Two Binary Covariates
  6. Confidence Interval for the Interaction Odds Ratio in Logistic Regression with Two Binary Covariates

These tables add to the range of logistic regression methods already available in nQuery, and allow versatility with significance tests in addition to confidence interval tables available.

Equivalence Tests

In this release, there is also a focus on equivalence tests for binary data. Equivalence testing is used to statistically evaluate how similar a proposed treatment is to a pre-existing standard treatment. This is a very common objective in areas such as generics and medical devices. This is particularly important if using a placebo group.

As equivalence testing will typically involve evaluation against a well-defined treatment (e.g. RLD), there is a lower incidence of the large parallel studies typically seen in Phase III clinical trials. One-sample, paired samples or cross-over designs are common as these will generally require a lower cost and sample size.

Three tables will be added in this area in the latest release:

  1. Equivalence Test for One Proportion
  2. Difference Equivalence Test for Two Correlated Proportions
  3. Ratio Equivalence Test for Two Correlated Proportions

These tables integrate more exact enumeration methods as an option in addition to the typical normal approximation methods. The one proportion test also includes a wide range of proposed test statistics, including an exact test and a variety of forms of Z-test.

Correlated proportions often occur where two different procedures, such as diagnostic tests, are carried out on all subjects in order to test the accuracy of the procedure. A level of correlation between the results would be expected in this situation. In equivalence tests with correlated proportions, the aim is to show that the two diagnostic procedures have the same level of accuracy.

These tables expand upon a large number of pre-existing tables available for the equivalence testing of binary proportions.

Continue to explore the new Core tables by clicking on the tabs above  green arrow for tab 1

List of New Core Tables

Crossover

  • MTT22 Test for Pairwise Mean Differences in a Williams Crossover Design
  • MTE25 Non-Inferiority Test for Pairwise Mean Differences in a Williams Crossover Design
  • MTE26 Equivalence Test for Pairwise Mean Differences in a Williams Crossover Design
  • MTE27 Superiority by a Margin Test for Pairwise Mean Differences in a Williams Crossover Design
  • PTT17 Test for Pairwise Proportion Differences in a Williams Crossover Design
  • PTE5 Non-Inferiority Test for Pairwise Proportion Differences in a Williams Crossover Design
  • PTE6 Equivalence Test for Pairwise Proportion Differences in a Williams Crossover Design
  • PTE7 Superiority by a Margin Test for Pairwise Proportion Differences in a Williams Crossover Design
  • PTT18 Test for Generalised Odds Ratio 2x2 Crossover
  • PTE9 Equivalence Test for Generalised Odds Ratio 2x2 Crossover
  • PTE10 Non-Inferiority Test Generalised Odds Ratio 2x2 Crossover 

Proportions

  • PTT14 Wald Test for One Binary Variable
  • PTT15 Wald Test for Two Binary Variables
  • PTT16 Wald Test for Interaction of Two Binary Variables
  • ROC1 Confidence Interval for Logistic Regression Odds Ratio for Binary Covariate
  • ROC2 Confidence Interval for Logistic Regression Odds Ratio for Two Binary Covariates
  • ROC3 Confidence Interval for Logistic Regression Interaction Odds Ratio for Two Binary Covariates
  • POE3 Difference Equivalence Test for Two Correlated Proportions
  • POE4 Difference Equivalence Test for One Proportion
  • POE5 Ratio Equivalence Test for Two Correlated Proportions

VIEW ALL SAMPLE SIZE PROCEDURES AVAILABLE IN nQuery

 Continue to explore the new Core tables by clicking on the tabs above  green arrow for tab 1

How to Update

If you have nQuery Advanced installed, nQuery should automatically prompt you to update.

You can manually update nQuery Advanced by clicking Help>Check for updates.

CLICK HERE FOR FULL DETAILS ABOUT UPDATING

nQuery Advanced Check for Updates

If your nQuery home screen is different, you are using an older version of nQuery.
Please contact your Account Manager.

Ask A Question

Start your 14-day free trial

Try Now For Free