

Group Sequential Design trials like other types of adaptive trials, can be promising alternatives to traditional fixed-term trials. They offer the potential to reduce trial length and cost, and provide the opportunity to make earlier, data-driven choices around trial adjustment or cessation.
Planning such trials demands careful consideration of basic trial design and thorough assessment of detailed trial operating characteristics against other potential designs. nQuery offers a Monte-Carlo based Group Sequential Design Simulation Tool that can assess a range of Group Sequential Design scenarios.
In this guide we will cover how to simulate group sequential trials in nQuery
Assessing Operating Characteristics of Group Sequential Design Trials
The detailed operating characteristics of adaptive trials, like Group Sequential Design trials, can have a significant impact on performance indicators, such as Type I error control, statistical power, and average sample size. Careful assessment of these characteristics can help compare the value of an adaptive design versus other types of adaptive design trials with different parameters, or even against equivalent fixed-term trials.
Clinical Trial Simulation
Simulation is a viable way to assess the operating characteristics of an adaptive design, including those with standard null, alternative, and arbitrary hypotheses, or any data-generating process. In fact, this approach is highlighted in FDA guidance on adaptive clinical trial design, which states:
“Clinical trial simulations often play a critical role in planning and designing clinical trials in general and are particularly important for adaptive trials. Simulations can be used, for example, to select the number and timing of interim analyses, or to determine the appropriate critical value of a test statistic for declaring efficacy or futility. Simulations can also be useful for comparing the performance of alternative designs. A major use of simulations in adaptive trial design is to estimate trial operating characteristics and to demonstrate that these operating characteristics meet desired levels.”[1]
Group Sequential Design Simulation Tool in nQuery
The Monte-Carlo-based nQuery Group Sequential Design Simulation Tool can be used to assess a range of Group Sequential Design scenarios. It is available in both nQuery Pro and nQuery Expert. A brief overview of how the trial simulator uses key trial data to make predictions is provided below.
How Do You Set Up a Simulation for a Clinical Trial?
-
Step 0: Simulation Selection
-
Step 1: Simulation Inputs
-
Step 2: Sequential Design Inputs
-
Step 3: Boundary Table Settings
-
Step 4: Simulation Controls
-
Step 5: Explore Results
Set-up Steps in nQuery’s Group Sequential Design Simulator
nQuery’s Group Sequential Design Simulation Tool uses proposed trial characteristics to perform simulations and make assessments that can help teams optimize their trial design. Users set up and run simulations using a range of input steps, as described below.
Step 0: Simulation Selection
Users start by selecting the Group Sequential Design simulation scenario(s) of interest for their trial, such as:
- Endpoint of Interest (means, proportions, survival, counts, regression)
- Number of Groups (1, 2, >2)
- Analysis Method (inequality, equivalence, non-inferiority)
Step 1: Simulation Inputs
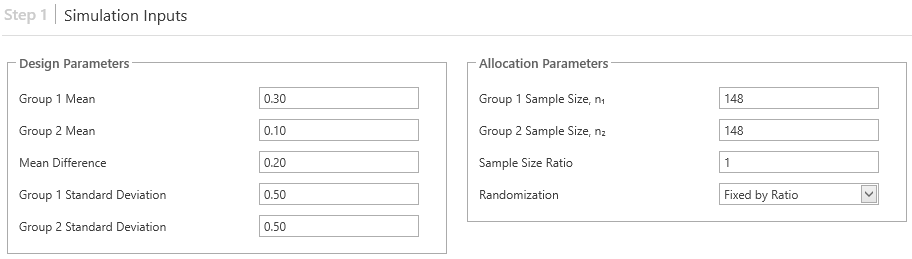
Simulation Inputs specify the data generating model that will be used to generate simulations for the scenario of interest. They include:
- Design Parameters: These are the endpoint-specific parameters passed to the statistical distribution(s) used to generate simulations. For example, a two means inequality scenario would require input of mean and standard deviations for both group 1 and group 2, as well as the mean difference between group 1 and group 2.
- Allocation Parameters: While allocation details will vary based on the number of groups chosen, these parameters are used to define how the sample size is allocated and randomized across the treatment groups (e.g., fixed by ratio or complete).
Step 2: Sequential Design Inputs
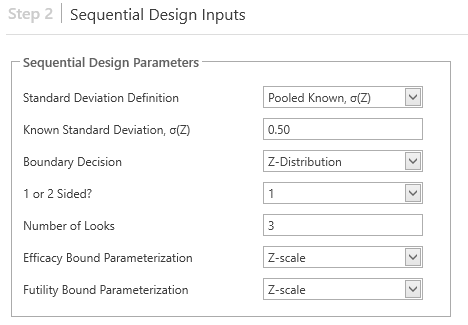
The specific Sequential Design Input factors needed to run an nQuery simulation will vary depending on the trial’s endpoint, number of groups, and analysis methods, but may include:
- Standard Deviation Definition (e.g., pooled known, unpooled known, pooled unknown, unpooled unknown)
- Known Standard Deviation
- Boundary Decision (e.g., original Z-test boundaries or approximate t-test)
- 1 or 2 Sided (whether to conduct one- or two-sided tests)
- Number of Looks (including final analysis)
- Efficacy Bound Parameterization (i.e., the statistical scale on which the group sequential efficacy boundaries are specified: Z-scale, p-value scale, score scale, δ-scale and no efficacy boundary)
- Futility Bound Parameterization (i.e., the statistical scale on which the group sequential futility boundaries are specified: Z-scale, p-value scale, score scale, δ-scale and no futility boundary)
Step 3: Boundary Table Settings
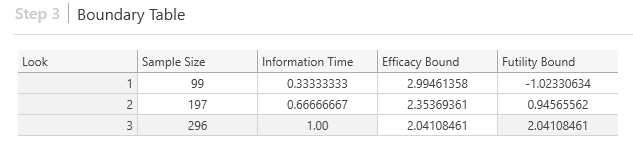
Group Sequential boundaries are defined within a boundary table using factors such as the look number, sample size, information time, and bound (e.g., efficacy, futility, upper efficacy, lower efficacy, upper futility, lower futility). The simulated test statistics calculated at each look are compared to the specified boundaries in order determine the outcome at that look (e.g., stop for efficacy, stop for futility, continue). So long as there is a sufficient number of simulations, this can then help estimate the exit probability at each look.
Step 4: Simulation Controls
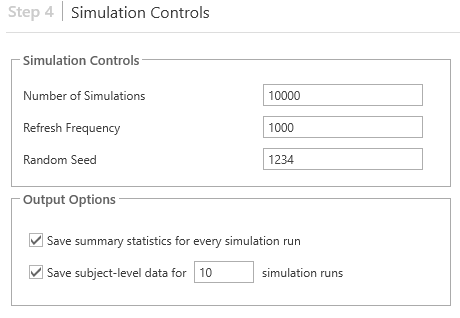
Users can choose how many simulated trials they want to run within a Simulation Control field. The default is 10,000. In general, the greater the number of simulations, the more reliable the estimates. This Simulations Control menu also lets users set how often results will be refreshed during a simulation. Random simulations can also be set. From this menu, users can also fine tune settings for how data are saved, and how often, as well as the specifics on how those data are output to reports.
Outputs from nQuery’s Group Sequential Design Simulator
The Group Sequential Design Simulator in nQuery provides several different outputs in order to help users better understand, explore, and visualize the results of their simulation(s). The main output formats include:
- Simulation Report: Provides a detailed summary of the inputs and simulation results for the current simulation, including an average power percentage indicating simulations in which the trial stopped for efficacy.
- Rejection Plot: Presents a visual summary of the decisions made at each analysis regarding stopping for efficacy, stopping for futility, or continuing to the next look.
- Boundary Plot: Includes both a visual and tabular summary of the group sequential boundaries, as well as the related exit and continuation regions at each look.
- Output Tables (optional): Provide access to the underlying simulation data on a summary and per-simulation basis.
These outputs can also be saved and exported for further analysis and collaboration.

Rejection Plot from nQuery’s Group Sequential Design Simulator
Learn More About nQuery’s Group Sequential Design Functionality
nQuery’s Group Sequential Design Simulator provides a powerful tool for assessing and optimizing adaptive clinical trial designs through comprehensive simulation. By using Monte Carlo simulations to analyze various trial parameters, the tool enables researchers to predict operating characteristics, such as statistical power and Type I error rates, across multiple trial scenarios.
This capability supports critical decision-making regarding the timing of interim analyses, stopping rules for efficacy or futility, and sample size allocation, ensuring a well-informed, efficient trial design. Through detailed outputs like rejection and boundary plots, the simulator offers valuable insights that help streamline trial processes, control costs, and ultimately facilitate data-driven adjustments to bring therapies to market more swiftly and reliably.
nQuery Group Sequential Design Tools
In addition to the Group Sequential Design Simulator, nQuery offers a range of complementary Group Sequential Design Tools to support detailed trial planning before simulation. This companion functionality provides numerous methodologies for determining suitable efficacy and futility boundaries for a Group Sequential Design, including the Lan-DeMets error spending method, Haybittle-Peto and Wang-Tsiatis boundary methods, as well as other classical, united family, and custom calculation approaches.
Group Sequential Design Overview Video
To learn more about Group Sequential Design with nQuery, watch a quick overview video that highlights the benefits of Group Sequential Design and demonstrates how nQuery helps optimize trial design by providing a variety of approaches for calculating efficacy and futility boundaries, as well as specifying and assessing other study parameters. Watch the overview video.
Reference
- Adaptive Designs for Clinical Trials of Drugs and Biologics: Guidance for Industry. U.S. Department of Health and Human Services, Food and Drug Administration, Center for Drug Evaluation and Research (CDER), and Center for Biologics Evaluation and Research (CBER). November 2019.
How to Simulate Group Sequential Trials in nQuery
Gain a deeper understanding of group sequential designs in nQuery by reviewing an overview of nQuery’s Group Sequential Design techniques.
View the webinar below for an in-depth exploration and explore real-world examples of sequential designs implemented in clinical trials.