Release Notes
Discover what's new
in nQuery

Version 9.6
From fixed to flexible trial designs, nQuery 9.6 is a major update to help biostatisticians and clinical researchers save costs and reduce risk.
Highlights include:
.png)
Jump to Section
nQuery 9.6 Release Notes
nQuery Pro Tier
What's new in the PRO tier of nQuery 9.6?
7 new sample size tables/features added to the Pro tier of nQuery 9.6 in the following areas:
- Group Sequential Design Overhaul (3 Tables)
- Two-Stage Phase II Designs (Simon's Design) (2 Tables)
- Phase II Selection Design (1 Table + update)
1. Group Sequential Design Overhaul
What is it?
Group Sequential Design is the most common adaptive design used in confirmatory clinical trials. This design allows trialists to stop a trial early at pre-specified interim analyses if there is sufficient evidence that treatment is effective (efficacy) or ineffective (futility). Group sequential designs capacity to stop trials early can lead to significant cost savings while also getting vital treatments into the hands of patients faster. Methods such as the Lan-DeMets error spending function give trialists significant flexibility to define the conditions under which a trial will stop early while maintaining significant flexibility during trial monitoring.
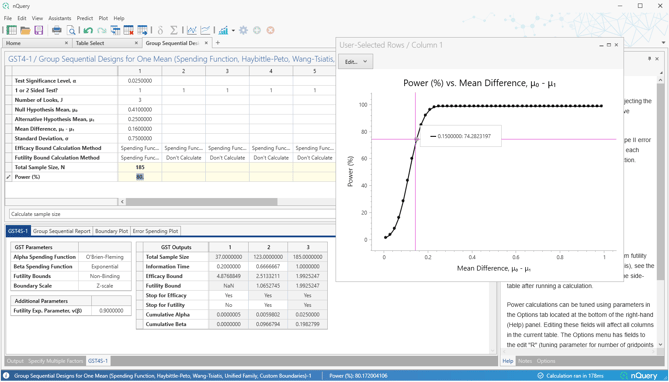
Overhauled group sequential tables include a number of additional group sequential methods, substantial improvements in user experience and additional detailed outputs to better explore different group sequential scenarios.
nQuery 9.6 adds an overhauled group sequential table for the one sample means, two counts (Poisson) and the two sample log-rank test (constant accrual, hazard rates) scenarios. These build upon the overhauled group sequential tables added since nQuery 9.3. Future updates will expand to additional scenarios.
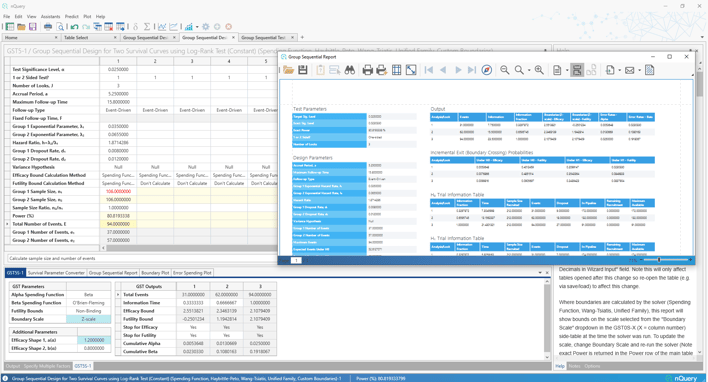
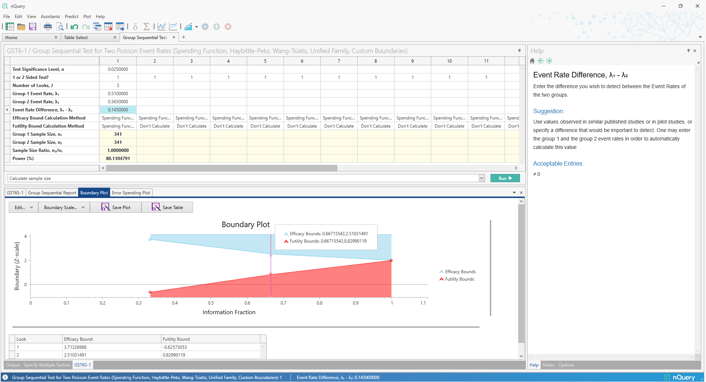
Overhauled Tables added:
-
Group Sequential Design for One Mean
-
Group Sequential Design for Log-Rank Test (Constant Accrual %, Hazard Rates)
-
Group Sequential Design for Two Counts (Poisson)
Group Sequential Design Overhaul Summary:
-
11 Spending Functions (O'Brien-Fleming, Pocock, Power Family, Hwang-Shih-DeCani, Exponential, Beta, t-distribution, Logistic, Normal, Cauchy, User Defined/Interpolated)
-
Wang-Tsiatis & Pampallona-Tsiatis Designs
-
Haybittle-Peto (p-value) Design
-
Unified Family Design
-
Custom Boundary Design with custom Z statistic, p-value, Score Statistic or Effect Size boundary inputs
-
2-sided Futility Boundaries
-
New user-responsive interface
-
Boundary Parameterization Conversion
-
Detailed & Exportable Group Sequential Reports
-
Improved Editable Boundary Plots
-
Error Spending Plots
2. Two-Stage Phase II Designs (Simon's Design)
What is it?
Early Phase II designs are often used to determine whether a new procedure or treatment is likely to meet a basic level of efficacy to warrant further development or evaluation (proof-of-concept). Two-stage designs are a common approach used in proof-of-concept trials to allow for flexibility to stop trials early for futility since Phase II is the most common failure point in drug evaluation.
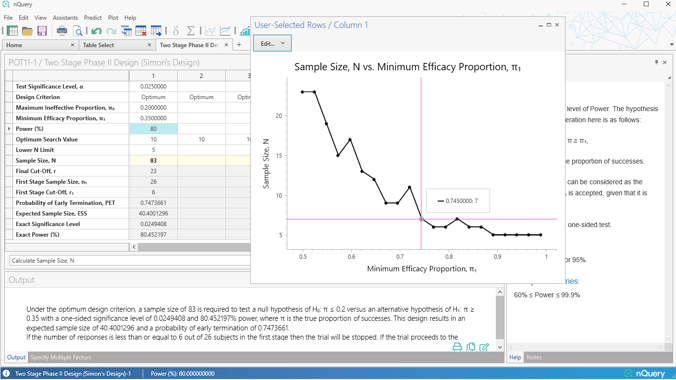
One of the most common two-stage designs used in Phase II clinical trials is Simon's Two-Stage design. The Simon two-stage design is an exact design which allows flexibility regarding the null and alternative hypotheses while also allowing stopping for futility. Simon's original optimal design, which has the smallest expected sample size, and the minimax design, which has the smallest maximum sample size.
The nQuery 9.6 release extends the Simon's Design offering from our nQuery 8.5 update by adding in options for more flexible Simon's type designs.
Firstly, a table is added which finds the full set of "admissible" designs - designs which find a balance between the maximum and expected sample size and provide more potential design options beyond the minimax and optimal designs.
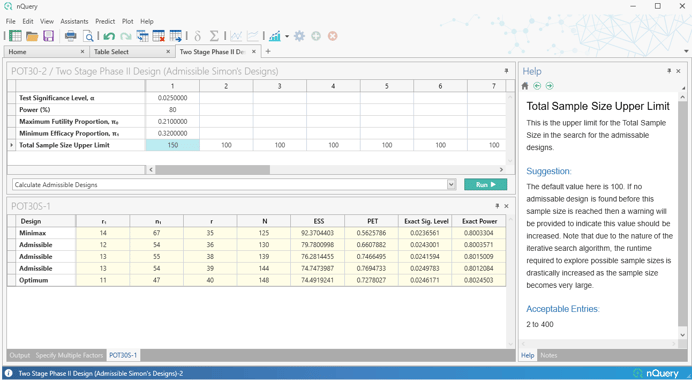
Secondly, a fully custom two-stage table is added which allows the specification of an arbitrary set of stopping rules and then allows calculation of the empirical Type I/Type II errors for that design. We also added a "Custom" option for our existing Simon's Design table (POT11) which allows the user to find the total sample size given custom stopping rules and a target power.
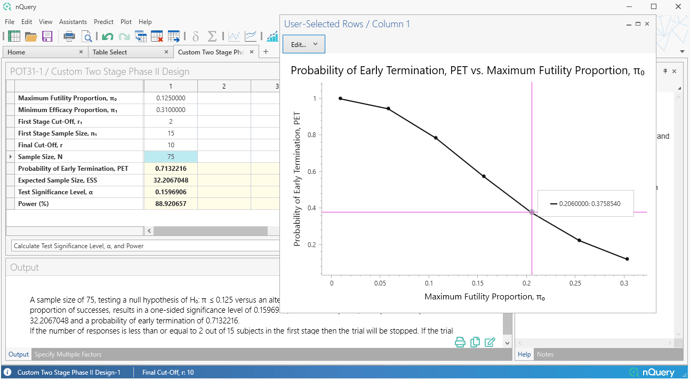
Tables Added:
- Admissible Simon's Designs
- Custom Two Stage (Simon's) Phase II Designs
Table Improvement:
- POT11: Two Stage Phase II Design (Simon's Design) - Added "Custom" Design Criterion
3. Phase II (Simon’s) Selection Design
What is it?
Selecting the right treatment or dose among competing options is a common problem in clinical trial development. A variety of designs and proposals have been put forward to help solve this issue. One early proposal from Simon, Wittes and Ellenberg (1985) was a design which randomized subjects to a number of equally sized groups and then selected the winner group as being that which achieved the highest response rate. This is often referred to as the Phase II Simon's Randomization Design and is a type of selection design or pick-the-winner design.
Their paper also derived the required exact calculations for the probability a given design would select the best group. In nQuery 9.6, this calculation is used to derive a sample size determination for a Phase II Simon's Randomization Designs based on a target probability of selecting the best group.
%20Selection%20Design.png?width=3456&height=1944&name=PGT7%20-%20Phase%20II%20(Simon%E2%80%99s)%20Selection%20Design.png)
Tables Added:
- Phase II Pick the Winner Design (Simon's Selection Design)
How to update?
If you have a subscription for the nQuery Pro Tier nQuery should automatically prompt you to update. You can manually update nQuery by clicking Help>Check for updates.
To discuss any aspect of your subscription, click here.
nQuery Base Tier
What's new in the Base tier of nQuery 9.6?
13 new sample size tables/updates have been added to the Base tier of nQuery 9.6 in the following areas:
- Multi-Regional Clinical Trials (4 Tables)
- Vaccines (2 Tables)
- Bioequivalence (1 Table)
- Correlation (1 Table)
- X-Axis Custom Values Plot Feature
4. Multi-Regional Clinical Trials
What is it?
Multi-regional clinical trials (MRCT) are trials which are conducted in multiple regions under a single study protocol. They have rapidly grown in usage as they offer the potential for substantial savings in time and money by providing sufficient evidence for regulatory approval in multiple regions based on a single high-quality confirmatory clinical trial compared to the traditional approach of multiple confirmatory trials plus the potential requirement for additional bridging studies for approval in specific jurisdictions.
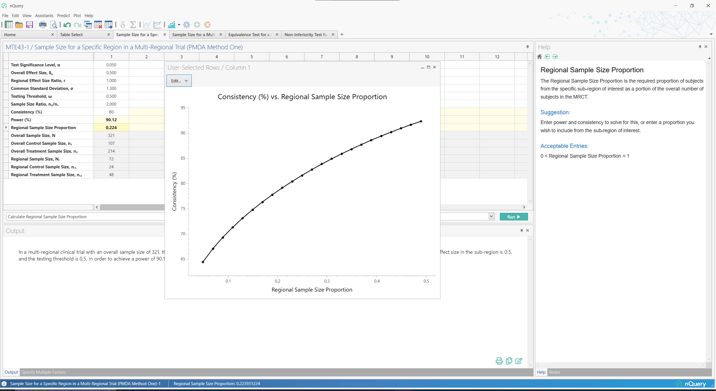
Due to their popularity, there has been a growth in regulatory guidance for MRCT. One consideration that was of concern to regulators was how to allocate sample size across regions appropriately such that the results would be generalizable to their region of interest. Two sample size criteria were defined by the Japanese regulator (PMDA) to establish the allocation required in the Japan region if approval was sought using an MRCT. These were then integrated into the five options included in the landmark ICH E17 Guidance (2017) as the "Preservation of Effect" and "Local Significance" criteria for sample size allocation across regions.
In nQuery 9.6, sample size allocation tables are added based on the first (Local Significance) and second (Preservation of Effect) PMDA criteria for sample size allocation in a multi-regional clinical trial. In addition, tables are added for the bridging study approach where an additional trial is required in a region for approval.
Tables Added:
- Sample Size for a Specific Region in a Multi-Regional Trial (PMDA Method One)
- Sample Size for a Multi-Regional Trial (PMDA Method Two)
- Non-Inferiority Test for a Bridging Study for Two Means
- Equivalence Test for a Bridging Study for Two Means
5. Vaccine Studies
What is it?
Vaccines are one of the most successful medical innovations in clinical history. However the unique nature of vaccines where they are provided to entire populations rather than just patients with the disease of interest provides unique challenges when designing clinical trials. Therefore, trial design considerations such as sample size need to integrate these challenges to ensure optimal trial outcomes.
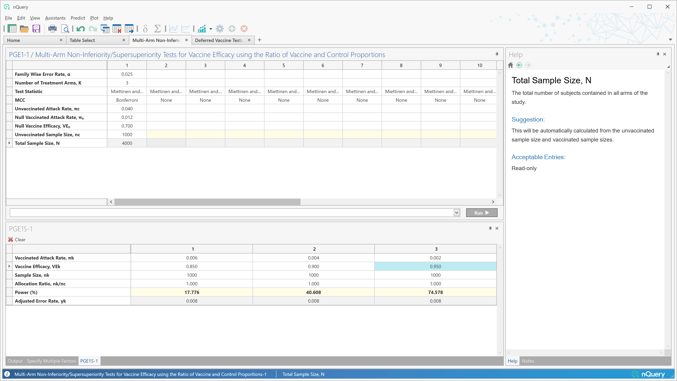
Vaccine efficacy is the primary target in clinical trials and the basis for most new vaccine approvals. But there is interest in designs for vaccine efficacy beyond the most common two-arm parallel design.
However, trials may be of interest for other vaccine characteristics such as vaccine safety, vaccine durability and impact vaccine boosters. Innovative design approaches are required to study these aspects of vaccine performance.
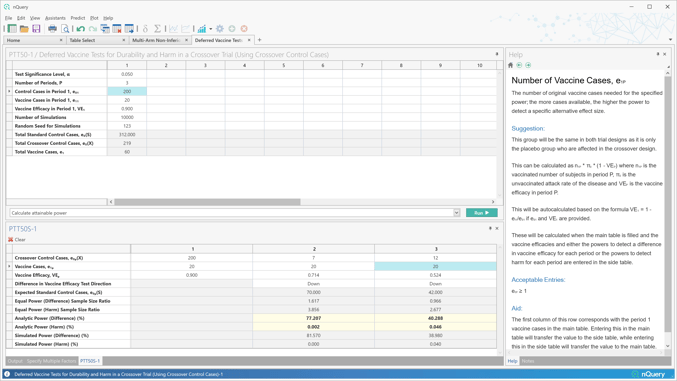
nQuery 9.6 builds on the 8 vaccine design tables added in nQuery 9.5 by adding a table for vaccine efficacy in the multi-arm scenario and by extending the deferred vaccine harm/durability calculations to crossover controls.
Tables Added:
- Multi-Arm Non-Inferiority/Supersuperiority Tests for Vaccine Efficacy using the Ratio of Vaccine and Control Proportions
- Deferred Vaccine Tests for Durability and Harm in a Crossover Trial (Using Crossover Control Cases)
6. Bioequivalence
What is it?
Bioequivalence testing is the most common route for the approval of new generic medicines. This testing consists of evaluating if the pharmacokinetics (PK) parameters Area under the Curve (AUC) and maximum concentration (Cmax) are equivalent using the two one-sided tests (TOST) or (equivalent) confidence interval approach.

Crossover designs are designs where each subject is given multiple treatments in a pre-specified sequence. The most common crossover design is a 2x2 design where each subject is given treatment with half given treatment, then control and other half given control and then treatment.
However, there are many higher-order cross-over designs which are also commonly used where issues such as multiple treatments/doses, highly variable drugs and/or interest in carryover or interaction effects.
nQuery 9.6 extends our major 10 table bioequivalence upgrade in nQuery 9.5 by adding a sample size tool for common higher-order cross-over designs such as the partial replicate and Williams designs on the original mean difference scale.
Table Added:
- Equivalence Test for Crossover Designs for (Original Scale)
- Differences (2x2x2, 2x2x3, 2x3x3 (Partial Replicate), 2x2x4, 2x4x2
- (Balaam's), 2x4x4, 3x3x3, 3x6x3, 4x4x4, 2x2x2r (Liu))
7. Correlation
What is it?
Correlations measures are interested in assessing the strength of the relationship between two variables. Common correlation measures include Pearson, Spearman and Kendall-Rank.
Dependent correlations indicate a common factor that may lead to a relationship between the two correlations which is equivalent to stating that at least one of the pairwise correlation coefficients is non-zero. When two correlations have a measurement index in common (here designated "y") then by comparison the correlations of two other measurements against the common measurement index must be dependent.
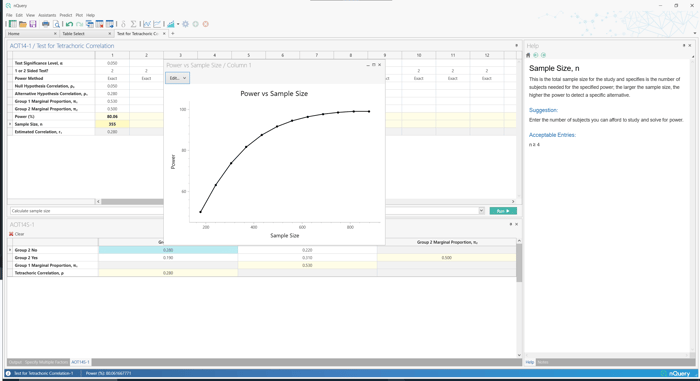
In nQuery 9.6, a table is added for tetrachoric correlation which can be used to assess the relationship between two continuous variables that have been measured using binary (dichotomous) data.
Tables added:
- Test for Tetrachoric Correlation
8. Plot Features
What is it?
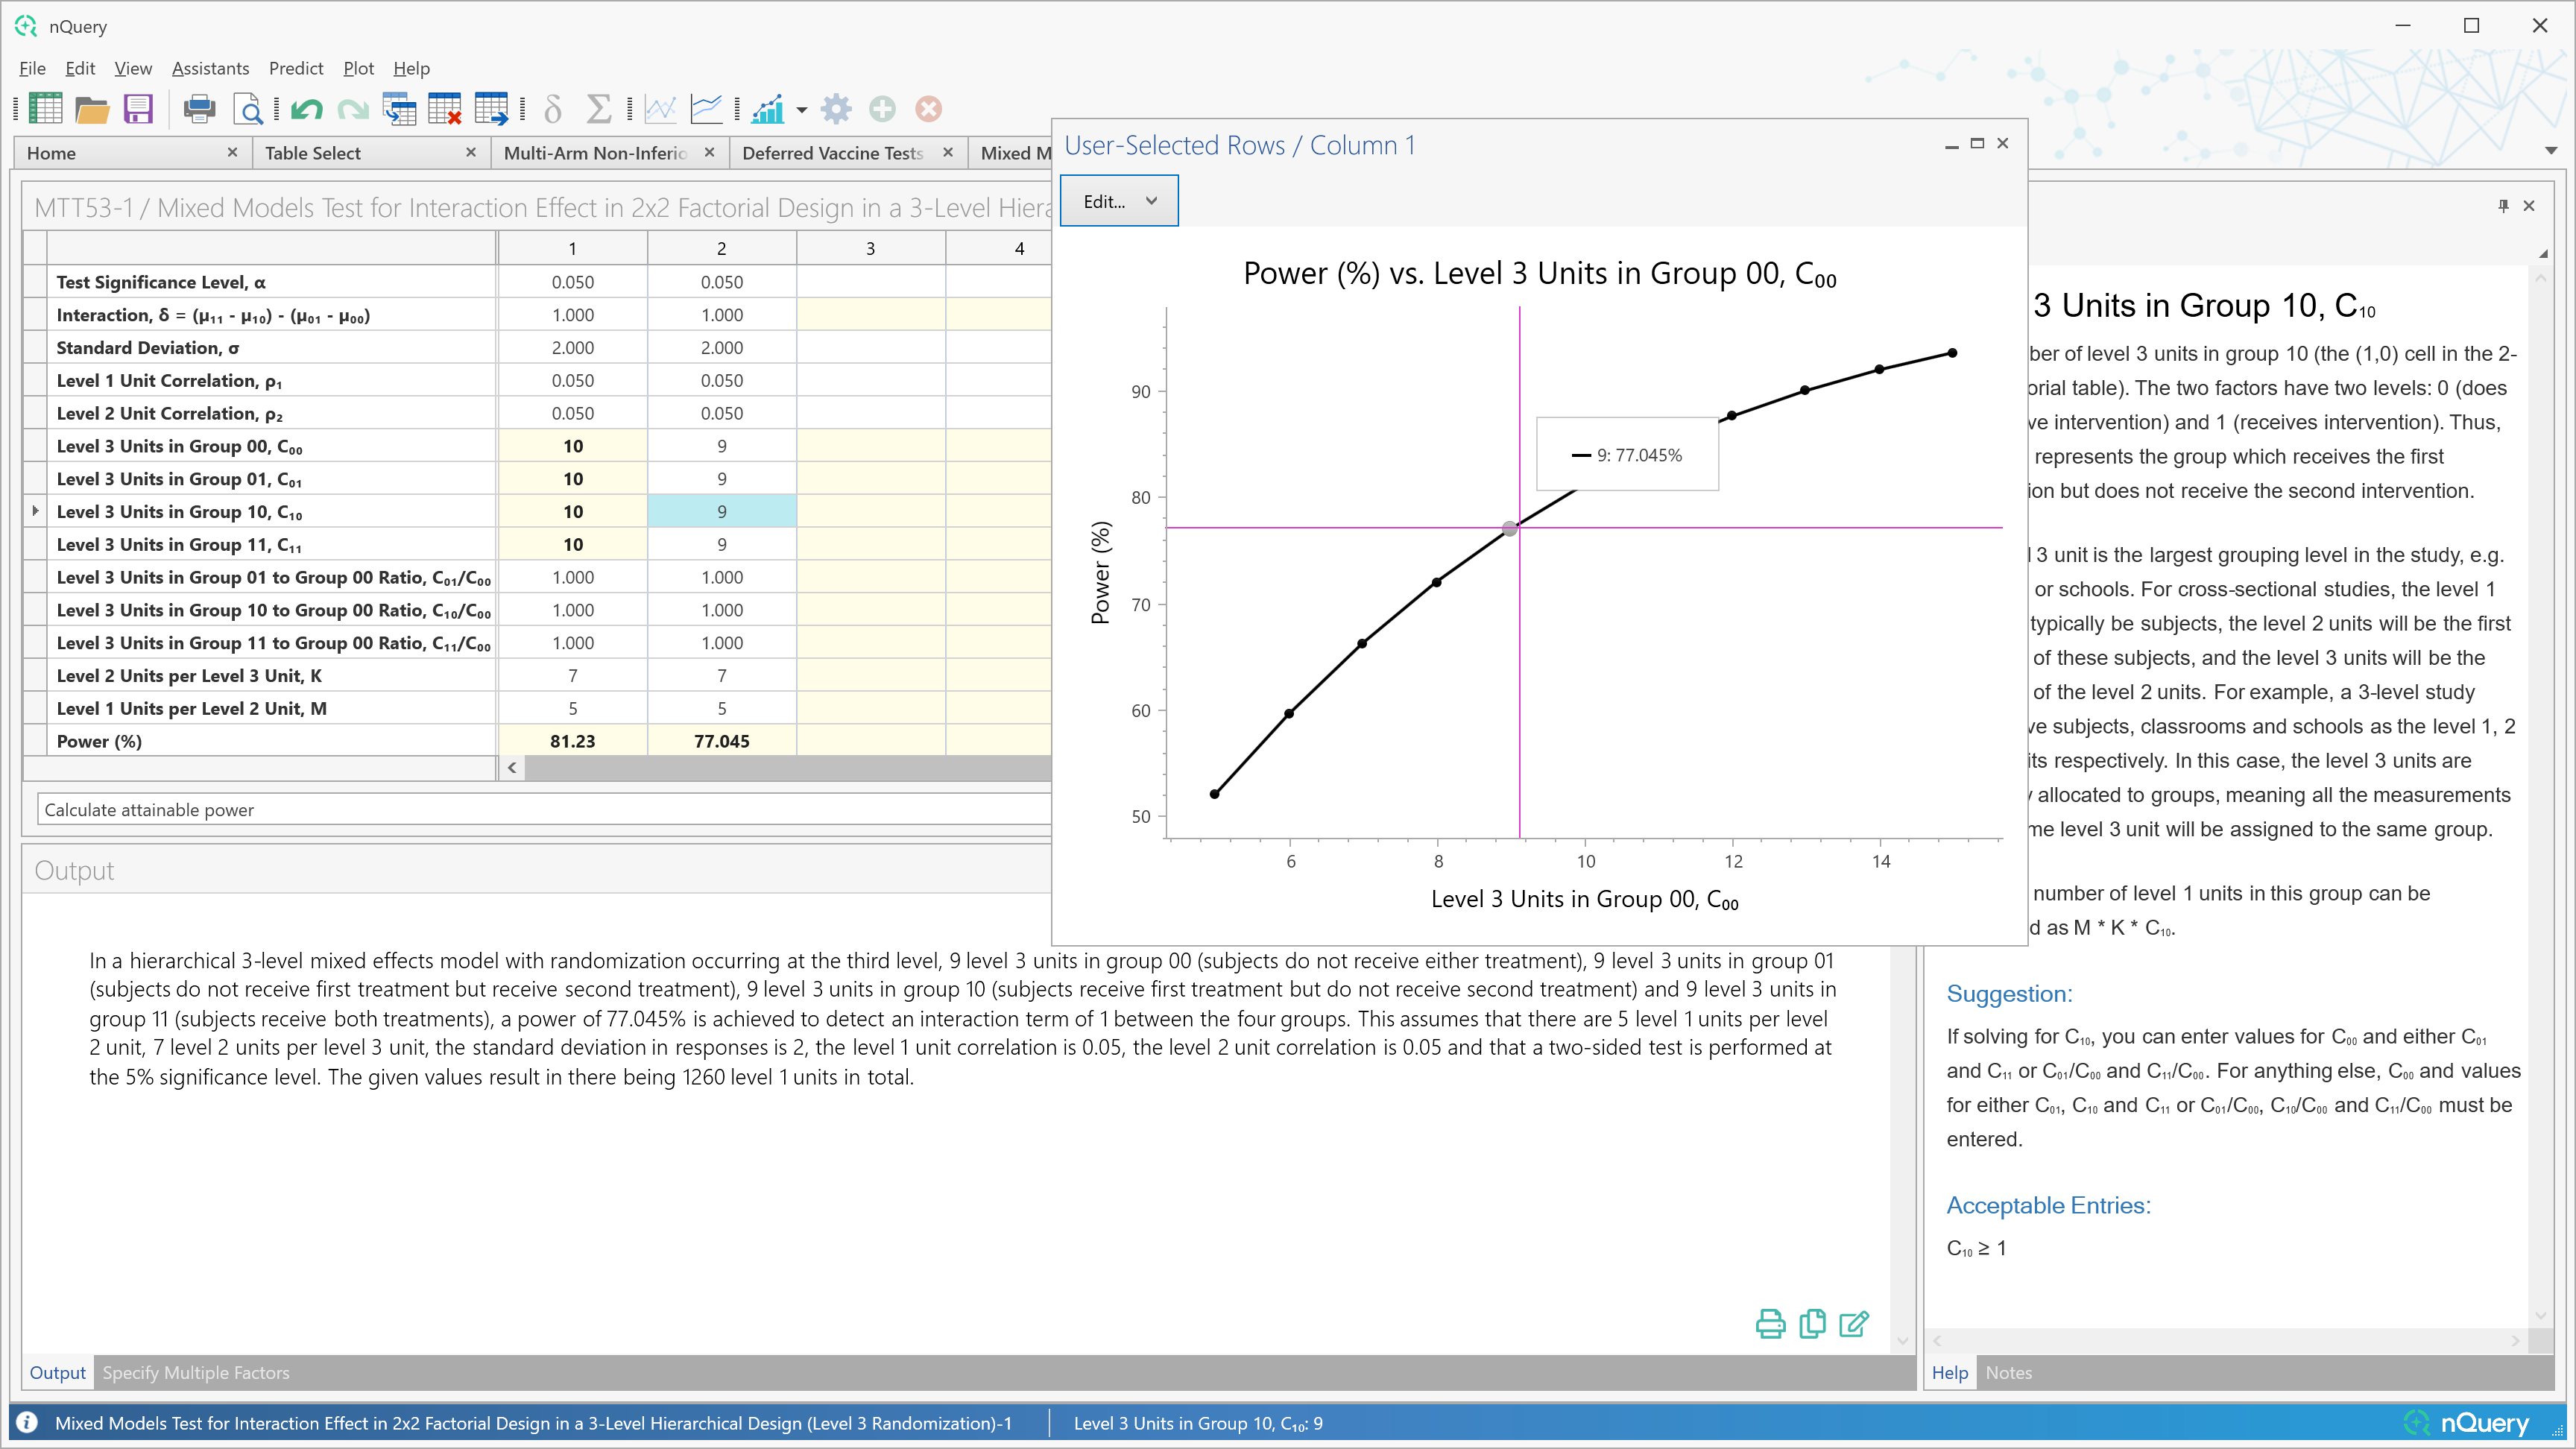
The Plot User Selected Rows functionality has provided an easy to use and powerful way to assess the relationship between a given input row and a given solver row across our design tables.
Up to now the values plotted for the input row was limited to specifying a minimum, maximum and step size to automatically generate the set of values plotted.
In nQuery 9.6, the "X-axis Custom Values" button will allow the user to fully specify the values of the input row which are desired and provides more power to users to generate the specific plot of interest to them.
nQuery Predict
Accurately predict your key trial milestones. Identify roadblocks and take action to keep your trial on schedule.
nQuery Predict is the most recent module to be added to the nQuery platform for clinical trial design.
Only available in the expert tier, nQuery Predict is a suite of tools that uses current data to project the likely trajectory of future enrollment or event milestones. With the nQuery Predict module, you can make more informed decisions based on real trial data as it becomes available.
Play this short video below for more information about milestone prediction
Get started with nQuery today
Start for free and upgrade as your team grows


