Getting Started
Learn How To Use nQuery

Jump to Section
Sample size calculation for survival analysis in nQuery
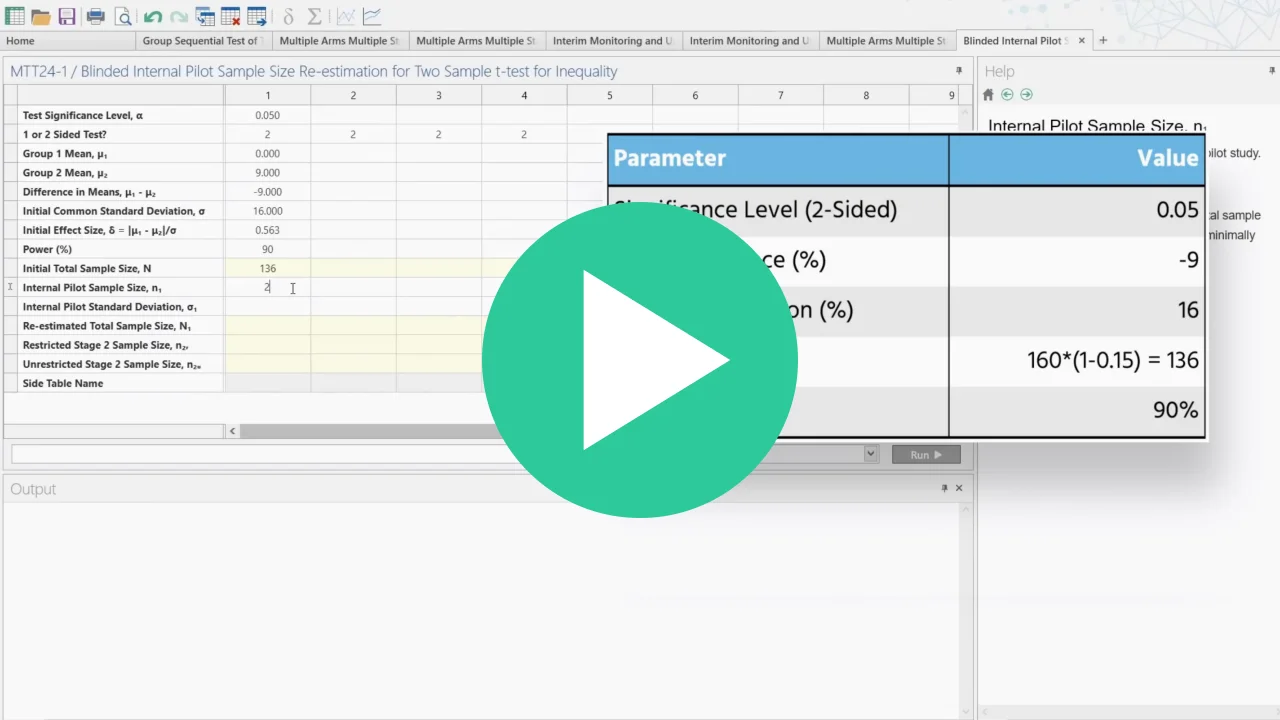
Blinded sample size re-estimation in nQuery

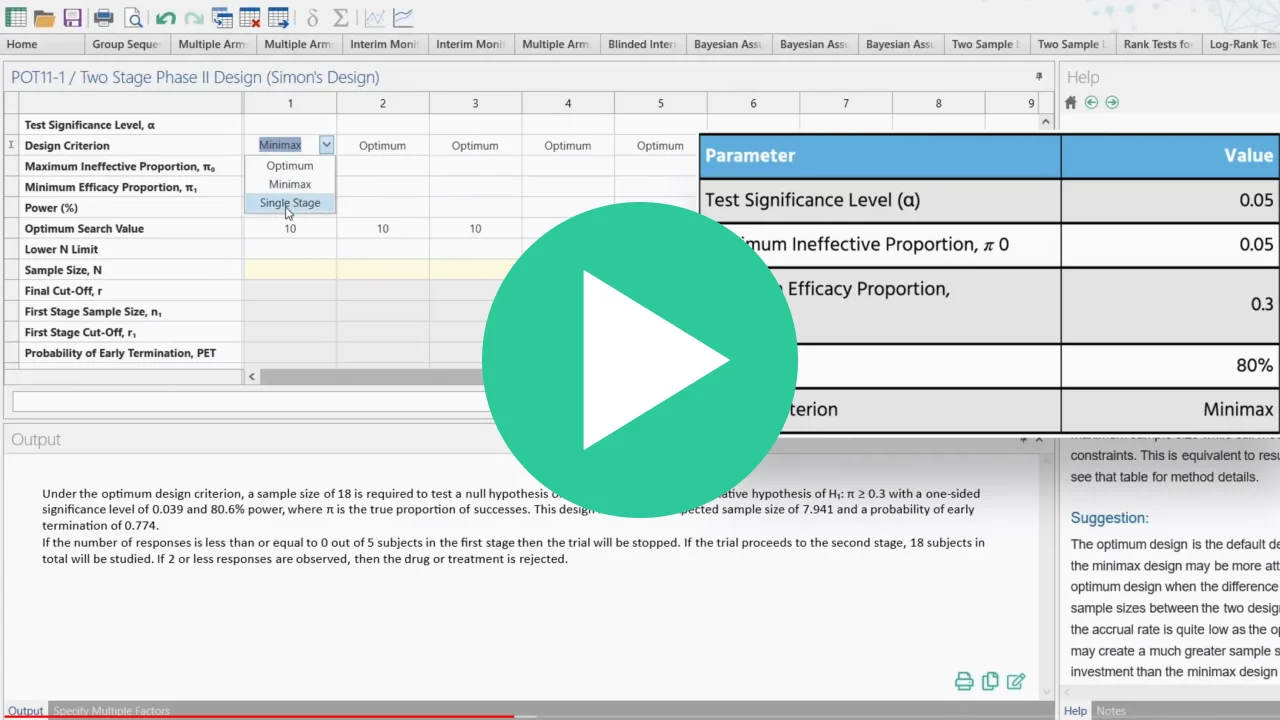
Simon’s two stage design in nQuery

MCP-Mod in nQuery
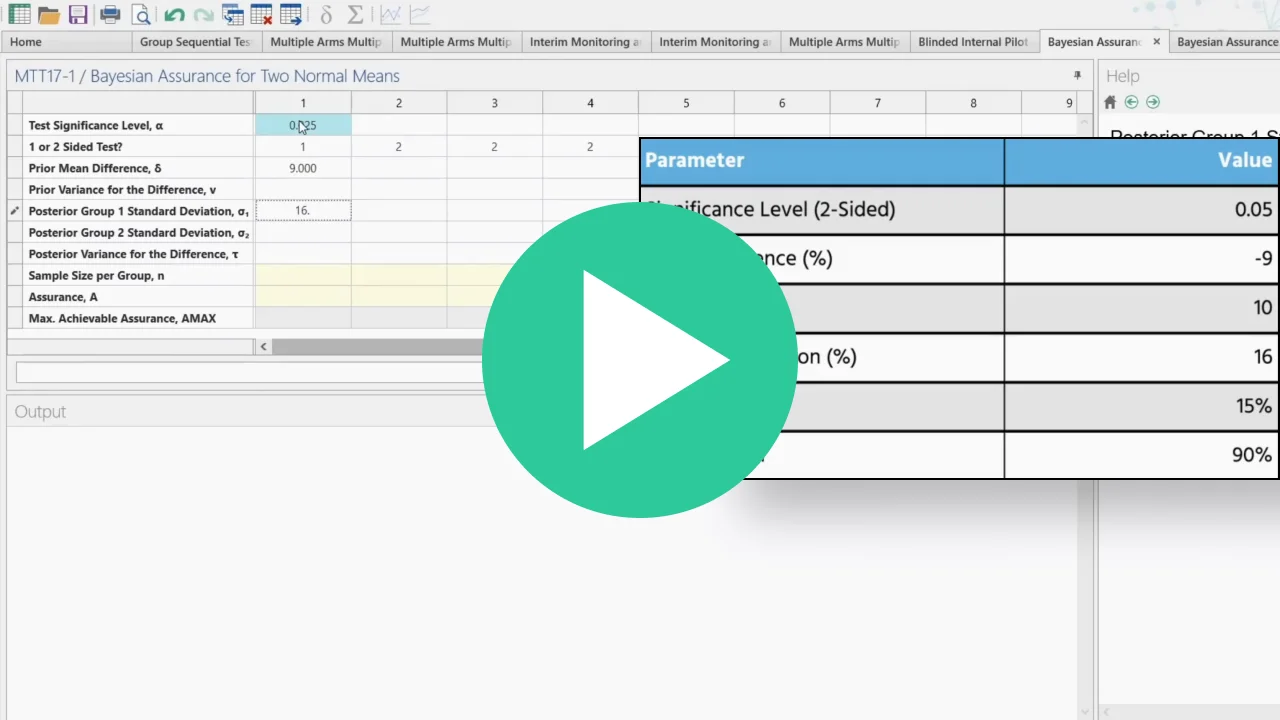
Completing a Bayesian assurance calculation in nQuery

Maximum Combination (Max Combo) test in nQuery

How to use nQuery Predict
Explore the latest nQuery Prediction module
Import your CSV file: To start using the latest prediction module, you must first import
a dataset.
If using the free online trial: Click the Prediction icon > Browse > Local Disk (C:) > CSVs. Then, depending on your goal choose SiteData.csv or SubjectData.csv
If using the desktop trial: Download both sets of example data below, to use with your desktop trial.
Frequently Asked Questions
What is nQuery Predict?
nQuery Predict is the latest module to be added to the nQuery platform for clinical trial design.
nQuery Predict is a suite of tools that uses current data to project the likely trajectory of future enrollment or event milestones.
With the nQuery Predict module, you can make more informed decisions based on real trial data as it becomes available.
How do I take a trial?
You can take a free 14-day trial of nQuery here.
How do I purchase?
nQuery Predict is included in our Expert Tier.
In addition to the predict module, you also have access to modules for Bayesian, adaptive trial design, and access to over 1000+ sample size scenarios.
You can purchase online here.
Have A Question?
You can get in contact with us here.
Predictive modeling in clinical trials
What is event prediction in clinical trials?
Event prediction is a complex problem in trials, such as those in oncology, that plan to use survival analysis.
Key decisions such as when to conduct an interim analysis or when to conduct right-censoring to finish the study are most commonly based on a priori unknown time when a given number of subjects will have had an event rather than based on the fixed follow-up more common in other areas. This means that accurate projections of when event milestones will be achieved are vital to provide realistic estimates of expected timings and costs.
nQuery Predict provides tools to project events based on both blinded (where treatment group is unknown) and unblinded (where treatment group is known) using multiple event models (exponential, piecewise, Weibull) and design considerations (e.g. fixed follow-up per subject).
What is enrollment prediction in clinical trials?
Enrollment prediction (i.e. how long will it take will achieve the desired sample size of patients) is an issue common across all trials and has a direct impact on the administration of a clinical trial. Slower than expected enrollment may mean that further resources may be required or that delays should be expected. These are serious economic considerations, particularly in expensive Phase III clinical trials.
Using Simulation for Enrollment and Event Predictions
Predicting key clinical trial milestones is vital to ensure that trialists can make informed decisions about study trends and ensure their trials remain on schedule. Trials will often have enrollment trends that vary from initial assumptions, requiring a recalibration of expectations and resources.
nQuery Predict gives you the ability to identify roadblocks and take action to keep your trial on schedule.
Recommended Viewing:
Predicting Key Study Milestones | Using Simulation for Enrollment and Event Predictions
You will learn about:
- Enrollment and Event Milestone Prediction Issues
- Using Simulation to Model and Project Enrollment
- Using Simulation to Model and Project Events in Survival Trials
Predict events using blinded & unblinded data
How to predict key events for survival analysis trials using blinded & unblinded data
Predicting event milestones is needed to ensure that survival trials remain on schedule for both interim and final analyses. Event prediction requires the consideration of a variety of possible influences alongside the events process itself such as accrual, the follow-up length per patient and dropout. Events prediction is further complicated by the high likelihood of only having access to blinded events data during a confirmatory clinical trial.
Recommended Viewing:
Using Simulation to Predict Events using Blinded & Unblinded Data
In this webinar, we will discuss the challenges of projecting events and how simulation can help provide the best estimate of the key events milestones using either unblinded or blinded interim data.
You will learn about:
- Event Milestone Prediction Complications
- Using Simulation to Predict Events using Unblinded Data
- Using Simulation to Predict Events using Blinded Data
Predict key events for survival analysis
Using simulation to model and project key events in survival trials
For survival (time-to-event) analysis, where key milestones relate to the number of events and the effect size, these considerations are even more important and also more complex to model.
Recommended Viewing:
Using Simulation for Enrollment and Event Predictions
We discuss the challenges of projecting enrollment and event trends and how simulation can be a powerful tool to assess whether your trial is on track to reach trial milestones on schedule and also model the possible changes needed to get a study back on track.
You will learn about:
- Using Simulation to Model and Project Events in Survival Trials
- Enrollment and Event Milestone Prediction Issues
- Using Simulation to Model and Project Enrollment
Pre-trial and interim trial predictions
Using simulation for Pre-trial and interim clinical trial predictions
While pre-trial assumptions are used to project when milestones will occur, it is vital to know if enrollment and survival trends are varying from the pre-trial assumptions. With nQuery Predict, re-evaluation of the trial’s trajectory and required resources can be made on real-time interim predictions.
Recommended Viewing:
Introducing nQuery Predict | A New Tool for Clinical Trial Milestone Predictions
We explore the challenges of predicting enrollment and event milestones in clinical trials. We show how nQuery Predict is a new tool for making pre-trial and interim predictions for key trial milestones and the variety of modelling options available for this task.
You will learn about:
- Enrollment and Event Milestone Prediction
- Using nQuery Predict for Interim Milestone Predictions
- Using nQuery Predict for Pre-trial Milestone Predictions
Enrollment & event prediction plots
nQuery Predict has plotting tools that allow data to be easily be shared from nQuery to all appropriate trial stakeholders. This allows the team to make informed decisions about what steps to take in their trial.
Enrollment Prediction Plot
The Enrollment Prediction Plot shows the trend in enrollment up until the Current Calendar Time and the projected average accruals in the trial in future.
The enrollment predictions include the average expected accruals and a prediction interval for the enrollment process up to the maximum study length, from all the simulations, based on the Target Sample Size being reached. The prediction interval is based on 5% and 95% percentiles across the simulations at each selected time point.
Events Prediction Plot
The Events Prediction Plot shows the trend in events (e.g. deaths) up until the Current Calendar Time and the projected average events expected in the trial in future.
The events predictions include the average expected number of events and a prediction interval for the events process up to the maximum study length, from all the simulations, based on the Target Events being reached. The prediction interval is based on 5% and 95% percentiles across the simulations at each selected time point.
Dropout Prediction Plot
The Dropout Prediction Plot shows the trend in dropouts up until the Current Calendar Time and the projected average dropouts in the trial in future.
The dropout predictions include the average expected dropout and a prediction interval for the dropout process up to the maximum study length, from all the simulations, based on the Target Events being reached. The prediction interval is based on 5% and 95% percentiles across the simulations at each selected time point.
Enrollment Prediction Table
The Enrollment Prediction Table contains the trend in accruals up until the Current Calendar Time and the projected average number of accruals in the trial in the future. The Enrollment Prediction Table is used to construct the Enrollment Prediction Plot
The enrollment predictions include the average expected number of accruals and a prediction interval for the enrollment process up to the maximum study length, from all the simulations, based on the Target Sample Size being reached. Note this plot does not take account of the case where the Target Events is reached before the Target Sample Size leading to the accrual process ending prematurely. The prediction interval is based on 5% and 95% percentiles across the simulations at each selected time point. A total of 100 data points are used with half for each of the pre and post-Current Calendar Time periods.
Recommended Viewing:
Introducing nQuery Predict | A New Tool for Clinical Trial Milestone Predictions
Get started with nQuery today
Start for free and upgrade as your team grows


